

It was found that the velocity of the probe-bead increased and reached a maximal
value, V max , then decreased to zero. The decrease was somewhat unexpected,
because the cell edge on the both sides of the probe bead seemed to continuously
advance at the same time. The decrease may be a phenomenon similar to that
observed with the lamellipodia under the water flow; the continuous protrusion of
the lamellipodium around the bead suggests that the bead affected the lamellipodial
motion rather locally (microscopic observation implied that the movement of the
edge was not affected when the edge was ~1 μm away from the bead).
During the protrusive phase, correlation existed between the V max and the velocity of the bead estimated from kymograph of the bead, as one might expect. One
would also expect that the V max value decreased when a few pN forces was applied
and the V max values decreased with the trap force, F max , which was calculated by k Â
X max , where X max corresponds to the displacement at which the velocity was V max .
However, as shown in Fig. 7.26a, even at the same F max , the V max scattered over a
wide range indicating no dependence of V max on the trap force.
It seemed that the result simply reflected a scattering of data. Actually, the
ensemble-averaged V max monotonically decreased with the trap stiffness
(Fig. 7.26b), making the scatter unlikely to be due to an experimental error. This
plot implies that the more restricted movement of the probe-bead was in the stiffer
trap was reflected in the velocity. One would argue that this is not surprising, because
the probe held by a “weak spring” will move with smaller forces. However, the
analysis or the degree of fluctuation suggested that this view had to be modified. The
size of the fluctuation of the probe-bead was calculated from the square-root of the
accumulated power spectral density of the fluctuation [169]. It was maximally
Laser
Video
Camera
Analysis
Objective
lens
Objective lens
Probe bead
Laser
Cell
Illumination
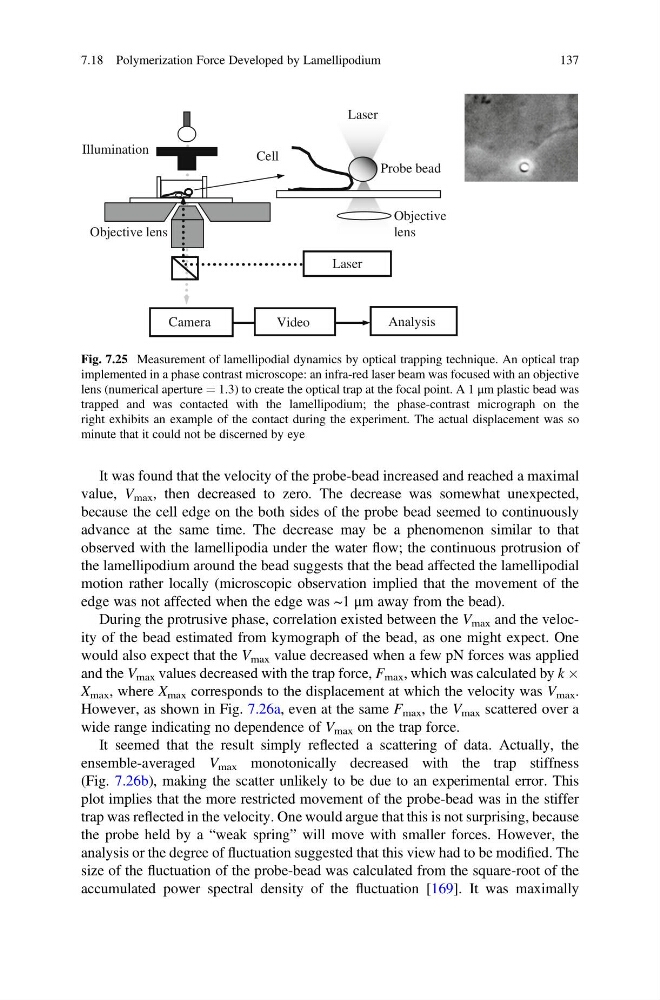
Fig. 7.25 Measurement of lamellipodial dynamics by optical trapping technique. An optical trap
implemented in a phase contrast microscope: an infra-red laser beam was focused with an objective
lens (numerical aperture ¼ 1.3) to create the optical trap at the focal point. A 1 μm plastic bead was
trapped and was contacted with the lamellipodium; the phase-contrast micrograph on the
right exhibits an example of the contact during the experiment. The actual displacement was so
minute that it could not be discerned by eye
7.18 Polymerization Force Developed by Lamellipodium
137
value, V max , then decreased to zero. The decrease was somewhat unexpected,
because the cell edge on the both sides of the probe bead seemed to continuously
advance at the same time. The decrease may be a phenomenon similar to that
observed with the lamellipodia under the water flow; the continuous protrusion of
the lamellipodium around the bead suggests that the bead affected the lamellipodial
motion rather locally (microscopic observation implied that the movement of the
edge was not affected when the edge was ~1 μm away from the bead).
During the protrusive phase, correlation existed between the V max and the velocity of the bead estimated from kymograph of the bead, as one might expect. One
would also expect that the V max value decreased when a few pN forces was applied
and the V max values decreased with the trap force, F max , which was calculated by k Â
X max , where X max corresponds to the displacement at which the velocity was V max .
However, as shown in Fig. 7.26a, even at the same F max , the V max scattered over a
wide range indicating no dependence of V max on the trap force.
It seemed that the result simply reflected a scattering of data. Actually, the
ensemble-averaged V max monotonically decreased with the trap stiffness
(Fig. 7.26b), making the scatter unlikely to be due to an experimental error. This
plot implies that the more restricted movement of the probe-bead was in the stiffer
trap was reflected in the velocity. One would argue that this is not surprising, because
the probe held by a “weak spring” will move with smaller forces. However, the
analysis or the degree of fluctuation suggested that this view had to be modified. The
size of the fluctuation of the probe-bead was calculated from the square-root of the
accumulated power spectral density of the fluctuation [169]. It was maximally
Laser
Video
Camera
Analysis
Objective
lens
Objective lens
Probe bead
Laser
Cell
Illumination
Fig. 7.25 Measurement of lamellipodial dynamics by optical trapping technique. An optical trap
implemented in a phase contrast microscope: an infra-red laser beam was focused with an objective
lens (numerical aperture ¼ 1.3) to create the optical trap at the focal point. A 1 μm plastic bead was
trapped and was contacted with the lamellipodium; the phase-contrast micrograph on the
right exhibits an example of the contact during the experiment. The actual displacement was so
minute that it could not be discerned by eye
7.18 Polymerization Force Developed by Lamellipodium
137