

354
T. Miyakawa et al.
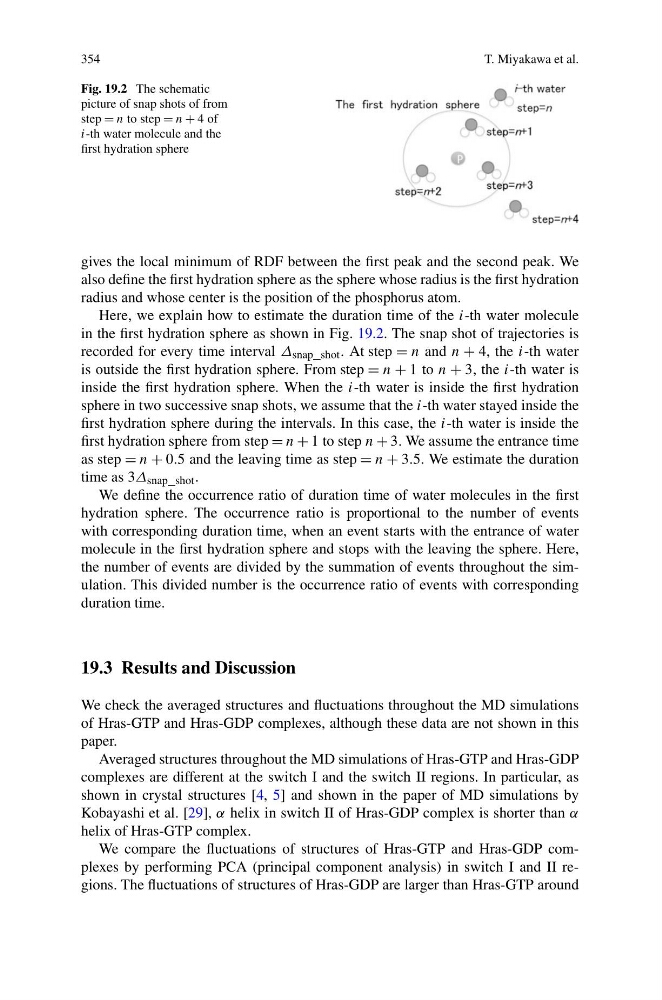
Fig. 19.2 The schematic
picture of snap shots of from
step = n to step = n + 4 of
i-th water molecule and the
first hydration sphere
gives the local minimum of RDF between the first peak and the second peak. We
also define the first hydration sphere as the sphere whose radius is the first hydration
radius and whose center is the position of the phosphorus atom.
Here, we explain how to estimate the duration time of the i-th water molecule
in the first hydration sphere as shown in Fig. 19.2. The snap shot of trajectories is
recorded for every time interval Δ snap_shot . At step = n and n + 4, the i-th water
is outside the first hydration sphere. From step = n + 1 to n + 3, the i-th water is
inside the first hydration sphere. When the i-th water is inside the first hydration
sphere in two successive snap shots, we assume that the i-th water stayed inside the
first hydration sphere during the intervals. In this case, the i-th water is inside the
first hydration sphere from step = n + 1 to step n + 3. We assume the entrance time
as step = n + 0.5 and the leaving time as step = n + 3.5. We estimate the duration
time as 3Δ snap_shot .
We define the occurrence ratio of duration time of water molecules in the first
hydration sphere. The occurrence ratio is proportional to the number of events
with corresponding duration time, when an event starts with the entrance of water
molecule in the first hydration sphere and stops with the leaving the sphere. Here,
the number of events are divided by the summation of events throughout the simulation. This divided number is the occurrence ratio of events with corresponding
duration time.
19.3 Results and Discussion
We check the averaged structures and fluctuations throughout the MD simulations
of Hras-GTP and Hras-GDP complexes, although these data are not shown in this
paper.
Averaged structures throughout the MD simulations of Hras-GTP and Hras-GDP
complexes are different at the switch I and the switch II regions. In particular, as
shown in crystal structures [4, 5] and shown in the paper of MD simulations by
Kobayashi et al. [29], α helix in switch II of Hras-GDP complex is shorter than α
helix of Hras-GTP complex.
We compare the fluctuations of structures of Hras-GTP and Hras-GDP complexes by performing PCA (principal component analysis) in switch I and II regions. The fluctuations of structures of Hras-GDP are larger than Hras-GTP around
T. Miyakawa et al.
Fig. 19.2 The schematic
picture of snap shots of from
step = n to step = n + 4 of
i-th water molecule and the
first hydration sphere
gives the local minimum of RDF between the first peak and the second peak. We
also define the first hydration sphere as the sphere whose radius is the first hydration
radius and whose center is the position of the phosphorus atom.
Here, we explain how to estimate the duration time of the i-th water molecule
in the first hydration sphere as shown in Fig. 19.2. The snap shot of trajectories is
recorded for every time interval Δ snap_shot . At step = n and n + 4, the i-th water
is outside the first hydration sphere. From step = n + 1 to n + 3, the i-th water is
inside the first hydration sphere. When the i-th water is inside the first hydration
sphere in two successive snap shots, we assume that the i-th water stayed inside the
first hydration sphere during the intervals. In this case, the i-th water is inside the
first hydration sphere from step = n + 1 to step n + 3. We assume the entrance time
as step = n + 0.5 and the leaving time as step = n + 3.5. We estimate the duration
time as 3Δ snap_shot .
We define the occurrence ratio of duration time of water molecules in the first
hydration sphere. The occurrence ratio is proportional to the number of events
with corresponding duration time, when an event starts with the entrance of water
molecule in the first hydration sphere and stops with the leaving the sphere. Here,
the number of events are divided by the summation of events throughout the simulation. This divided number is the occurrence ratio of events with corresponding
duration time.
19.3 Results and Discussion
We check the averaged structures and fluctuations throughout the MD simulations
of Hras-GTP and Hras-GDP complexes, although these data are not shown in this
paper.
Averaged structures throughout the MD simulations of Hras-GTP and Hras-GDP
complexes are different at the switch I and the switch II regions. In particular, as
shown in crystal structures [4, 5] and shown in the paper of MD simulations by
Kobayashi et al. [29], α helix in switch II of Hras-GDP complex is shorter than α
helix of Hras-GTP complex.
We compare the fluctuations of structures of Hras-GTP and Hras-GDP complexes by performing PCA (principal component analysis) in switch I and II regions. The fluctuations of structures of Hras-GDP are larger than Hras-GTP around