

19 Analysis of Water Molecules in the Hras-GTP and GDP Complexes
353
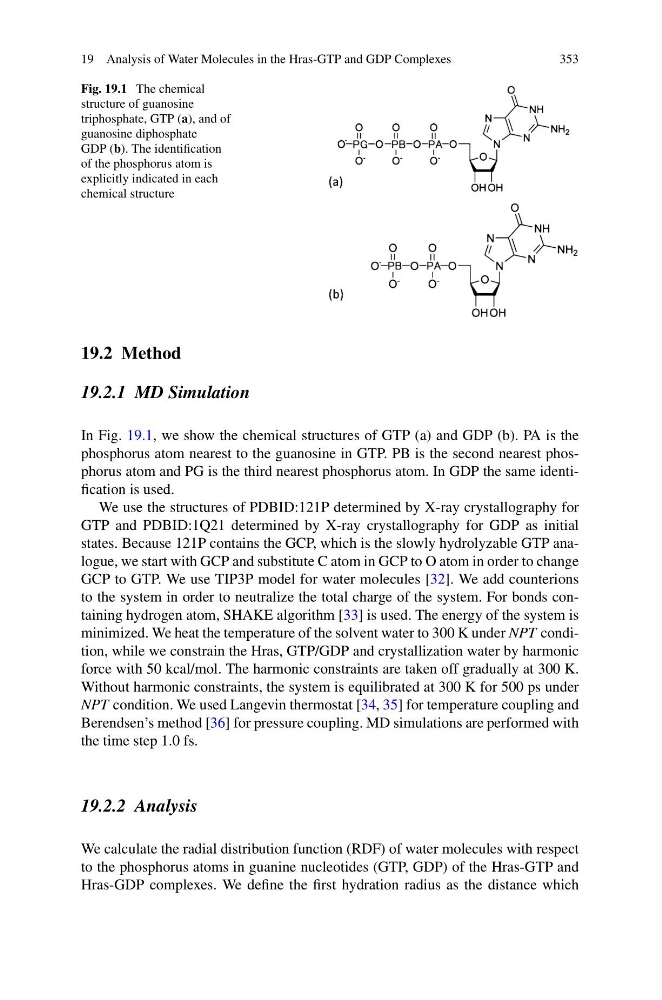
Fig. 19.1 The chemical
structure of guanosine
triphosphate, GTP (a), and of
guanosine diphosphate
GDP (b). The identification
of the phosphorus atom is
explicitly indicated in each
chemical structure
19.2 Method
19.2.1 MD Simulation
In Fig. 19.1, we show the chemical structures of GTP (a) and GDP (b). PA is the
phosphorus atom nearest to the guanosine in GTP. PB is the second nearest phosphorus atom and PG is the third nearest phosphorus atom. In GDP the same identification is used.
We use the structures of PDBID:121P determined by X-ray crystallography for
GTP and PDBID:1Q21 determined by X-ray crystallography for GDP as initial
states. Because 121P contains the GCP, which is the slowly hydrolyzable GTP analogue, we start with GCP and substitute C atom in GCP to O atom in order to change
GCP to GTP. We use TIP3P model for water molecules [32]. We add counterions
to the system in order to neutralize the total charge of the system. For bonds containing hydrogen atom, SHAKE algorithm [33] is used. The energy of the system is
minimized. We heat the temperature of the solvent water to 300 K under NPT condition, while we constrain the Hras, GTP/GDP and crystallization water by harmonic
force with 50 kcal/mol. The harmonic constraints are taken off gradually at 300 K.
Without harmonic constraints, the system is equilibrated at 300 K for 500 ps under
NPT condition. We used Langevin thermostat [34, 35] for temperature coupling and
Berendsen’s method [36] for pressure coupling. MD simulations are performed with
the time step 1.0 fs.
19.2.2 Analysis
We calculate the radial distribution function (RDF) of water molecules with respect
to the phosphorus atoms in guanine nucleotides (GTP, GDP) of the Hras-GTP and
Hras-GDP complexes. We define the first hydration radius as the distance which
353
Fig. 19.1 The chemical
structure of guanosine
triphosphate, GTP (a), and of
guanosine diphosphate
GDP (b). The identification
of the phosphorus atom is
explicitly indicated in each
chemical structure
19.2 Method
19.2.1 MD Simulation
In Fig. 19.1, we show the chemical structures of GTP (a) and GDP (b). PA is the
phosphorus atom nearest to the guanosine in GTP. PB is the second nearest phosphorus atom and PG is the third nearest phosphorus atom. In GDP the same identification is used.
We use the structures of PDBID:121P determined by X-ray crystallography for
GTP and PDBID:1Q21 determined by X-ray crystallography for GDP as initial
states. Because 121P contains the GCP, which is the slowly hydrolyzable GTP analogue, we start with GCP and substitute C atom in GCP to O atom in order to change
GCP to GTP. We use TIP3P model for water molecules [32]. We add counterions
to the system in order to neutralize the total charge of the system. For bonds containing hydrogen atom, SHAKE algorithm [33] is used. The energy of the system is
minimized. We heat the temperature of the solvent water to 300 K under NPT condition, while we constrain the Hras, GTP/GDP and crystallization water by harmonic
force with 50 kcal/mol. The harmonic constraints are taken off gradually at 300 K.
Without harmonic constraints, the system is equilibrated at 300 K for 500 ps under
NPT condition. We used Langevin thermostat [34, 35] for temperature coupling and
Berendsen’s method [36] for pressure coupling. MD simulations are performed with
the time step 1.0 fs.
19.2.2 Analysis
We calculate the radial distribution function (RDF) of water molecules with respect
to the phosphorus atoms in guanine nucleotides (GTP, GDP) of the Hras-GTP and
Hras-GDP complexes. We define the first hydration radius as the distance which