

298
E.F. Sheka et al.
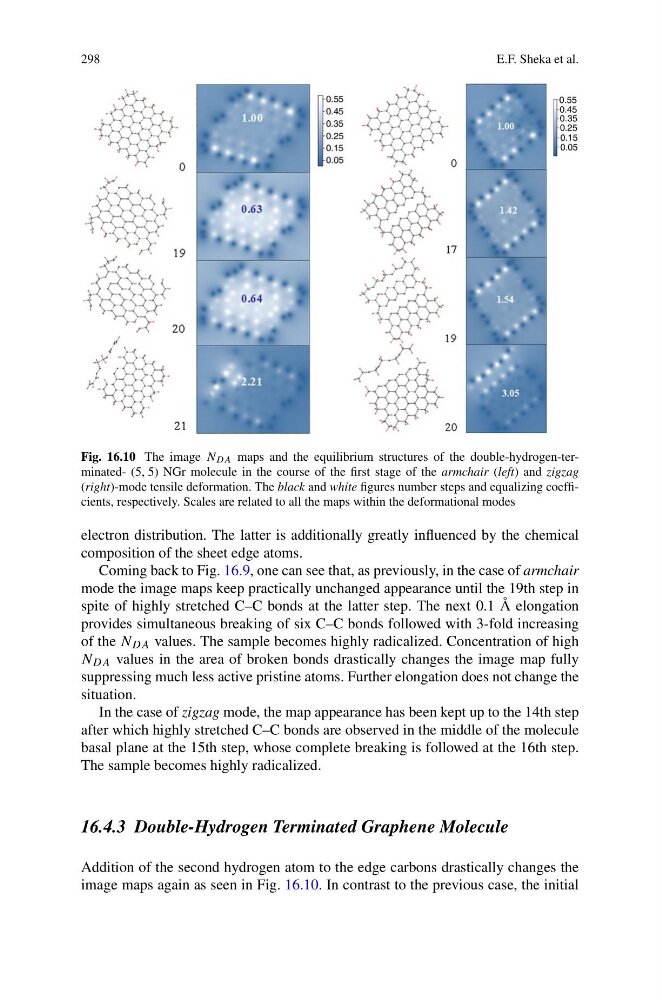
Fig. 16.10 The image N DA maps and the equilibrium structures of the double-hydrogen-terminated- (5, 5) NGr molecule in the course of the first stage of the armchair (left) and zigzag
(right)-mode tensile deformation. The black and white figures number steps and equalizing coefficients, respectively. Scales are related to all the maps within the deformational modes
electron distribution. The latter is additionally greatly influenced by the chemical
composition of the sheet edge atoms.
Coming back to Fig. 16.9, one can see that, as previously, in the case of armchair
mode the image maps keep practically unchanged appearance until the 19th step in
spite of highly stretched C–C bonds at the latter step. The next 0.1 Å elongation
provides simultaneous breaking of six C–C bonds followed with 3-fold increasing
of the N DA values. The sample becomes highly radicalized. Concentration of high
N DA values in the area of broken bonds drastically changes the image map fully
suppressing much less active pristine atoms. Further elongation does not change the
situation.
In the case of zigzag mode, the map appearance has been kept up to the 14th step
after which highly stretched C–C bonds are observed in the middle of the molecule
basal plane at the 15th step, whose complete breaking is followed at the 16th step.
The sample becomes highly radicalized.
16.4.3 Double-Hydrogen Terminated Graphene Molecule
Addition of the second hydrogen atom to the edge carbons drastically changes the
image maps again as seen in Fig. 16.10. In contrast to the previous case, the initial
E.F. Sheka et al.
Fig. 16.10 The image N DA maps and the equilibrium structures of the double-hydrogen-terminated- (5, 5) NGr molecule in the course of the first stage of the armchair (left) and zigzag
(right)-mode tensile deformation. The black and white figures number steps and equalizing coefficients, respectively. Scales are related to all the maps within the deformational modes
electron distribution. The latter is additionally greatly influenced by the chemical
composition of the sheet edge atoms.
Coming back to Fig. 16.9, one can see that, as previously, in the case of armchair
mode the image maps keep practically unchanged appearance until the 19th step in
spite of highly stretched C–C bonds at the latter step. The next 0.1 Å elongation
provides simultaneous breaking of six C–C bonds followed with 3-fold increasing
of the N DA values. The sample becomes highly radicalized. Concentration of high
N DA values in the area of broken bonds drastically changes the image map fully
suppressing much less active pristine atoms. Further elongation does not change the
situation.
In the case of zigzag mode, the map appearance has been kept up to the 14th step
after which highly stretched C–C bonds are observed in the middle of the molecule
basal plane at the 15th step, whose complete breaking is followed at the 16th step.
The sample becomes highly radicalized.
16.4.3 Double-Hydrogen Terminated Graphene Molecule
Addition of the second hydrogen atom to the edge carbons drastically changes the
image maps again as seen in Fig. 16.10. In contrast to the previous case, the initial