

16 Topological Mechanochemistry of Graphene
297
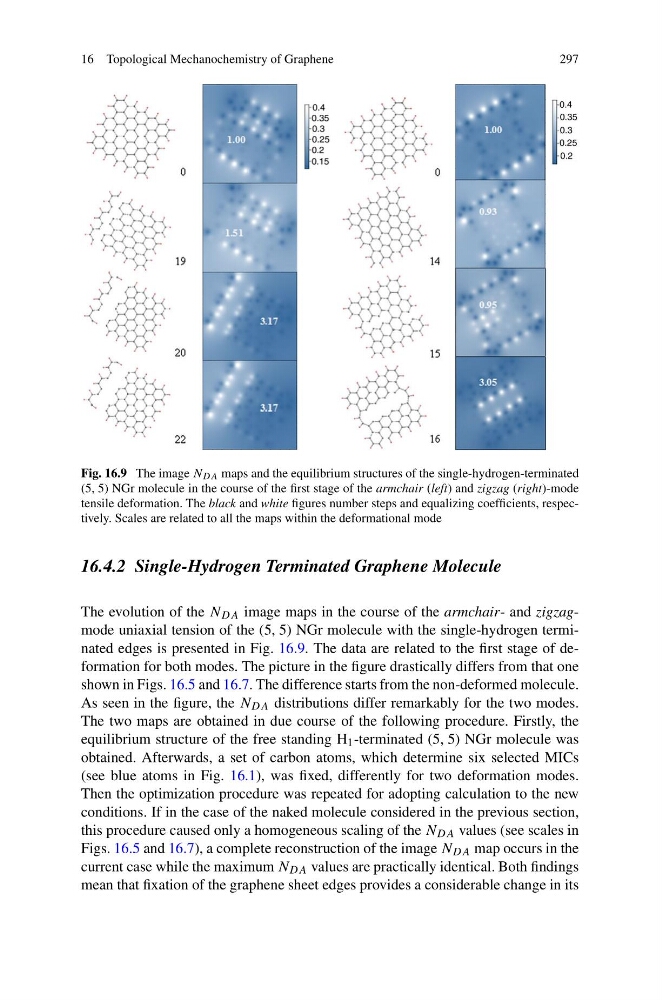
Fig. 16.9 The image N DA maps and the equilibrium structures of the single-hydrogen-terminated
(5, 5) NGr molecule in the course of the first stage of the armchair (left) and zigzag (right)-mode
tensile deformation. The black and white figures number steps and equalizing coefficients, respectively. Scales are related to all the maps within the deformational mode
16.4.2 Single-Hydrogen Terminated Graphene Molecule
The evolution of the N DA image maps in the course of the armchair- and zigzagmode uniaxial tension of the (5, 5) NGr molecule with the single-hydrogen terminated edges is presented in Fig. 16.9. The data are related to the first stage of deformation for both modes. The picture in the figure drastically differs from that one
shown in Figs. 16.5 and 16.7. The difference starts from the non-deformed molecule.
As seen in the figure, the N DA distributions differ remarkably for the two modes.
The two maps are obtained in due course of the following procedure. Firstly, the
equilibrium structure of the free standing H 1 -terminated (5, 5) NGr molecule was
obtained. Afterwards, a set of carbon atoms, which determine six selected MICs
(see blue atoms in Fig. 16.1), was fixed, differently for two deformation modes.
Then the optimization procedure was repeated for adopting calculation to the new
conditions. If in the case of the naked molecule considered in the previous section,
this procedure caused only a homogeneous scaling of the N DA values (see scales in
Figs. 16.5 and 16.7), a complete reconstruction of the image N DA map occurs in the
current case while the maximum N DA values are practically identical. Both findings
mean that fixation of the graphene sheet edges provides a considerable change in its
297
Fig. 16.9 The image N DA maps and the equilibrium structures of the single-hydrogen-terminated
(5, 5) NGr molecule in the course of the first stage of the armchair (left) and zigzag (right)-mode
tensile deformation. The black and white figures number steps and equalizing coefficients, respectively. Scales are related to all the maps within the deformational mode
16.4.2 Single-Hydrogen Terminated Graphene Molecule
The evolution of the N DA image maps in the course of the armchair- and zigzagmode uniaxial tension of the (5, 5) NGr molecule with the single-hydrogen terminated edges is presented in Fig. 16.9. The data are related to the first stage of deformation for both modes. The picture in the figure drastically differs from that one
shown in Figs. 16.5 and 16.7. The difference starts from the non-deformed molecule.
As seen in the figure, the N DA distributions differ remarkably for the two modes.
The two maps are obtained in due course of the following procedure. Firstly, the
equilibrium structure of the free standing H 1 -terminated (5, 5) NGr molecule was
obtained. Afterwards, a set of carbon atoms, which determine six selected MICs
(see blue atoms in Fig. 16.1), was fixed, differently for two deformation modes.
Then the optimization procedure was repeated for adopting calculation to the new
conditions. If in the case of the naked molecule considered in the previous section,
this procedure caused only a homogeneous scaling of the N DA values (see scales in
Figs. 16.5 and 16.7), a complete reconstruction of the image N DA map occurs in the
current case while the maximum N DA values are practically identical. Both findings
mean that fixation of the graphene sheet edges provides a considerable change in its