

242
T. Onishi and T. Helgaker
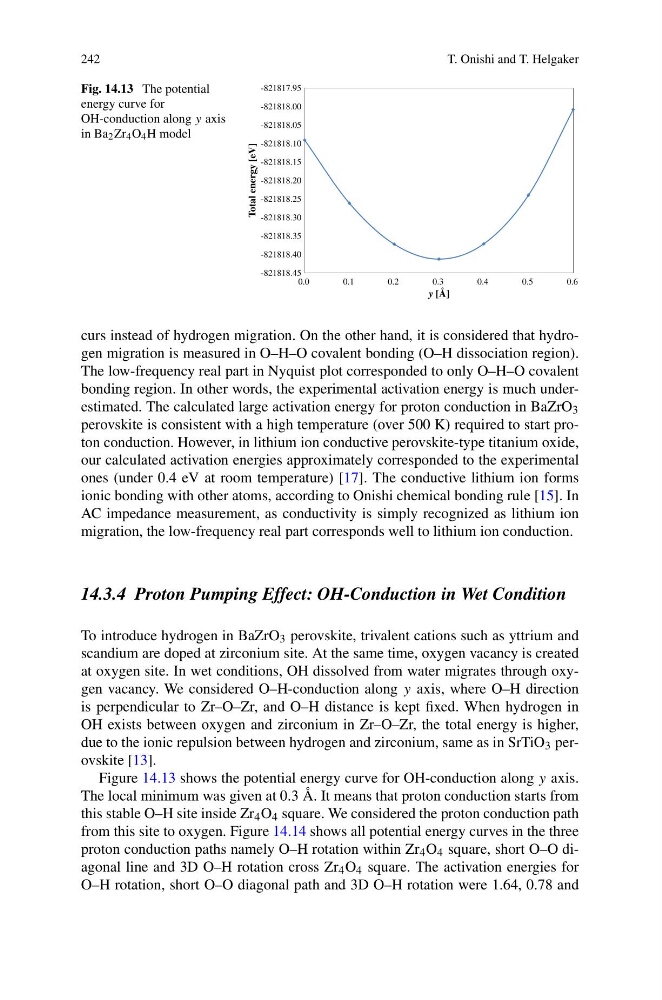
Fig. 14.13 The potential
energy curve for
OH-conduction along y axis
in Ba 2 Zr 4 O 4 H model
curs instead of hydrogen migration. On the other hand, it is considered that hydrogen migration is measured in O–H–O covalent bonding (O–H dissociation region).
The low-frequency real part in Nyquist plot corresponded to only O–H–O covalent
bonding region. In other words, the experimental activation energy is much underestimated. The calculated large activation energy for proton conduction in BaZrO 3
perovskite is consistent with a high temperature (over 500 K) required to start proton conduction. However, in lithium ion conductive perovskite-type titanium oxide,
our calculated activation energies approximately corresponded to the experimental
ones (under 0.4 eV at room temperature) [17]. The conductive lithium ion forms
ionic bonding with other atoms, according to Onishi chemical bonding rule [15]. In
AC impedance measurement, as conductivity is simply recognized as lithium ion
migration, the low-frequency real part corresponds well to lithium ion conduction.
14.3.4 Proton Pumping Effect: OH-Conduction in Wet Condition
To introduce hydrogen in BaZrO 3 perovskite, trivalent cations such as yttrium and
scandium are doped at zirconium site. At the same time, oxygen vacancy is created
at oxygen site. In wet conditions, OH dissolved from water migrates through oxygen vacancy. We considered O–H-conduction along y axis, where O–H direction
is perpendicular to Zr–O–Zr, and O–H distance is kept fixed. When hydrogen in
OH exists between oxygen and zirconium in Zr–O–Zr, the total energy is higher,
due to the ionic repulsion between hydrogen and zirconium, same as in SrTiO 3 perovskite [13].
Figure 14.13 shows the potential energy curve for OH-conduction along y axis.
The local minimum was given at 0.3 Å. It means that proton conduction starts from
this stable O–H site inside Zr 4 O 4 square. We considered the proton conduction path
from this site to oxygen. Figure 14.14 shows all potential energy curves in the three
proton conduction paths namely O–H rotation within Zr 4 O 4 square, short O–O diagonal line and 3D O–H rotation cross Zr 4 O 4 square. The activation energies for
O–H rotation, short O–O diagonal path and 3D O–H rotation were 1.64, 0.78 and
T. Onishi and T. Helgaker
Fig. 14.13 The potential
energy curve for
OH-conduction along y axis
in Ba 2 Zr 4 O 4 H model
curs instead of hydrogen migration. On the other hand, it is considered that hydrogen migration is measured in O–H–O covalent bonding (O–H dissociation region).
The low-frequency real part in Nyquist plot corresponded to only O–H–O covalent
bonding region. In other words, the experimental activation energy is much underestimated. The calculated large activation energy for proton conduction in BaZrO 3
perovskite is consistent with a high temperature (over 500 K) required to start proton conduction. However, in lithium ion conductive perovskite-type titanium oxide,
our calculated activation energies approximately corresponded to the experimental
ones (under 0.4 eV at room temperature) [17]. The conductive lithium ion forms
ionic bonding with other atoms, according to Onishi chemical bonding rule [15]. In
AC impedance measurement, as conductivity is simply recognized as lithium ion
migration, the low-frequency real part corresponds well to lithium ion conduction.
14.3.4 Proton Pumping Effect: OH-Conduction in Wet Condition
To introduce hydrogen in BaZrO 3 perovskite, trivalent cations such as yttrium and
scandium are doped at zirconium site. At the same time, oxygen vacancy is created
at oxygen site. In wet conditions, OH dissolved from water migrates through oxygen vacancy. We considered O–H-conduction along y axis, where O–H direction
is perpendicular to Zr–O–Zr, and O–H distance is kept fixed. When hydrogen in
OH exists between oxygen and zirconium in Zr–O–Zr, the total energy is higher,
due to the ionic repulsion between hydrogen and zirconium, same as in SrTiO 3 perovskite [13].
Figure 14.13 shows the potential energy curve for OH-conduction along y axis.
The local minimum was given at 0.3 Å. It means that proton conduction starts from
this stable O–H site inside Zr 4 O 4 square. We considered the proton conduction path
from this site to oxygen. Figure 14.14 shows all potential energy curves in the three
proton conduction paths namely O–H rotation within Zr 4 O 4 square, short O–O diagonal line and 3D O–H rotation cross Zr 4 O 4 square. The activation energies for
O–H rotation, short O–O diagonal path and 3D O–H rotation were 1.64, 0.78 and