

10 Structural and Thermodynamic Properties of Au 2–58 Clusters
191
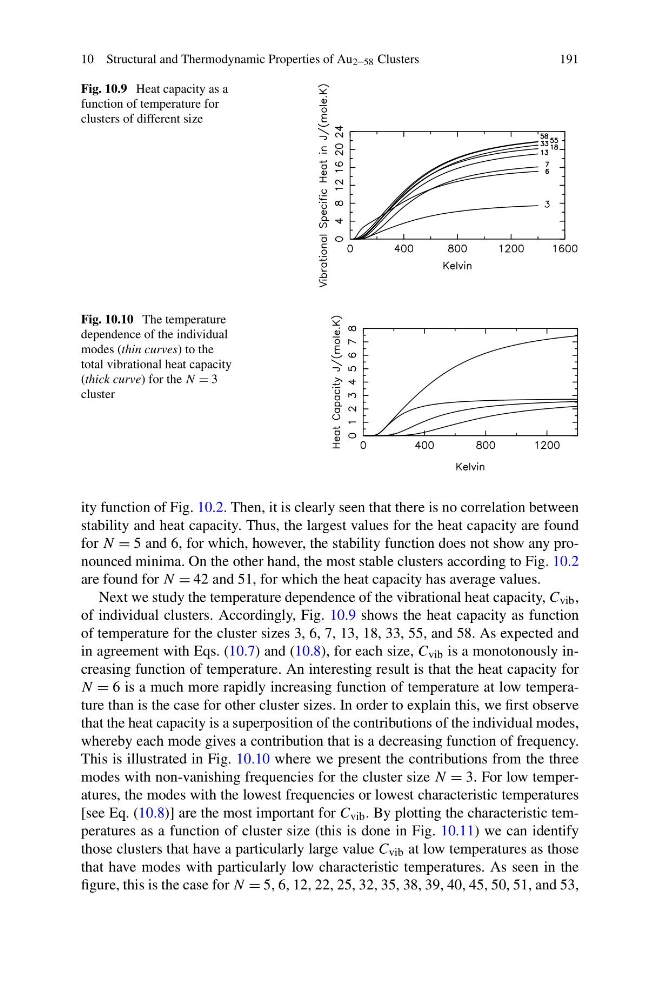
Fig. 10.9 Heat capacity as a
function of temperature for
clusters of different size
Fig. 10.10 The temperature
dependence of the individual
modes (thin curves) to the
total vibrational heat capacity
(thick curve) for the N = 3
cluster
ity function of Fig. 10.2. Then, it is clearly seen that there is no correlation between
stability and heat capacity. Thus, the largest values for the heat capacity are found
for N = 5 and 6, for which, however, the stability function does not show any pronounced minima. On the other hand, the most stable clusters according to Fig. 10.2
are found for N = 42 and 51, for which the heat capacity has average values.
Next we study the temperature dependence of the vibrational heat capacity, C vib ,
of individual clusters. Accordingly, Fig. 10.9 shows the heat capacity as function
of temperature for the cluster sizes 3, 6, 7, 13, 18, 33, 55, and 58. As expected and
in agreement with Eqs. (10.7) and (10.8), for each size, C vib is a monotonously increasing function of temperature. An interesting result is that the heat capacity for
N = 6 is a much more rapidly increasing function of temperature at low temperature than is the case for other cluster sizes. In order to explain this, we first observe
that the heat capacity is a superposition of the contributions of the individual modes,
whereby each mode gives a contribution that is a decreasing function of frequency.
This is illustrated in Fig. 10.10 where we present the contributions from the three
modes with non-vanishing frequencies for the cluster size N = 3. For low temperatures, the modes with the lowest frequencies or lowest characteristic temperatures
[see Eq. (10.8)] are the most important for C vib . By plotting the characteristic temperatures as a function of cluster size (this is done in Fig. 10.11) we can identify
those clusters that have a particularly large value C vib at low temperatures as those
that have modes with particularly low characteristic temperatures. As seen in the
figure, this is the case for N = 5, 6, 12, 22, 25, 32, 35, 38, 39, 40, 45, 50, 51, and 53,
191
Fig. 10.9 Heat capacity as a
function of temperature for
clusters of different size
Fig. 10.10 The temperature
dependence of the individual
modes (thin curves) to the
total vibrational heat capacity
(thick curve) for the N = 3
cluster
ity function of Fig. 10.2. Then, it is clearly seen that there is no correlation between
stability and heat capacity. Thus, the largest values for the heat capacity are found
for N = 5 and 6, for which, however, the stability function does not show any pronounced minima. On the other hand, the most stable clusters according to Fig. 10.2
are found for N = 42 and 51, for which the heat capacity has average values.
Next we study the temperature dependence of the vibrational heat capacity, C vib ,
of individual clusters. Accordingly, Fig. 10.9 shows the heat capacity as function
of temperature for the cluster sizes 3, 6, 7, 13, 18, 33, 55, and 58. As expected and
in agreement with Eqs. (10.7) and (10.8), for each size, C vib is a monotonously increasing function of temperature. An interesting result is that the heat capacity for
N = 6 is a much more rapidly increasing function of temperature at low temperature than is the case for other cluster sizes. In order to explain this, we first observe
that the heat capacity is a superposition of the contributions of the individual modes,
whereby each mode gives a contribution that is a decreasing function of frequency.
This is illustrated in Fig. 10.10 where we present the contributions from the three
modes with non-vanishing frequencies for the cluster size N = 3. For low temperatures, the modes with the lowest frequencies or lowest characteristic temperatures
[see Eq. (10.8)] are the most important for C vib . By plotting the characteristic temperatures as a function of cluster size (this is done in Fig. 10.11) we can identify
those clusters that have a particularly large value C vib at low temperatures as those
that have modes with particularly low characteristic temperatures. As seen in the
figure, this is the case for N = 5, 6, 12, 22, 25, 32, 35, 38, 39, 40, 45, 50, 51, and 53,