

manner, as in more chains bearing a single long branch, or is it concentrated in a
few multiply branched chains? In the multiply branched case, differences in the
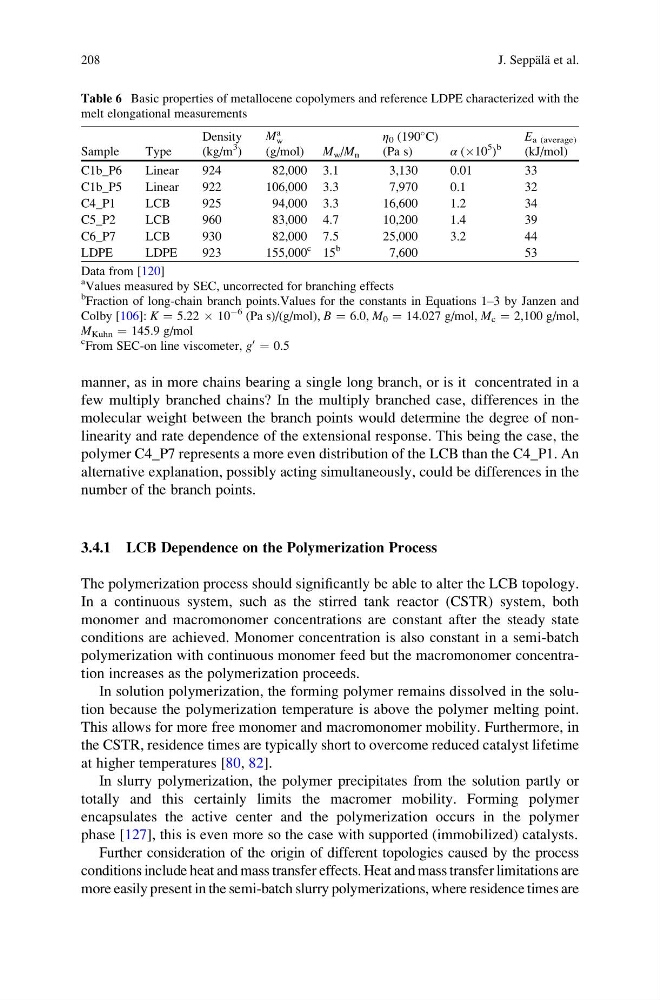
molecular weight between the branch points would determine the degree of nonlinearity and rate dependence of the extensional response. This being the case, the
polymer C4_P7 represents a more even distribution of the LCB than the C4_P1. An
alternative explanation, possibly acting simultaneously, could be differences in the
number of the branch points.
3.4.1 LCB Dependence on the Polymerization Process
The polymerization process should significantly be able to alter the LCB topology.
In a continuous system, such as the stirred tank reactor (CSTR) system, both
monomer and macromonomer concentrations are constant after the steady state
conditions are achieved. Monomer concentration is also constant in a semi-batch
polymerization with continuous monomer feed but the macromonomer concentration increases as the polymerization proceeds.
In solution polymerization, the forming polymer remains dissolved in the solution because the polymerization temperature is above the polymer melting point.
This allows for more free monomer and macromonomer mobility. Furthermore, in
the CSTR, residence times are typically short to overcome reduced catalyst lifetime
at higher temperatures [80, 82].
In slurry polymerization, the polymer precipitates from the solution partly or
totally and this certainly limits the macromer mobility. Forming polymer
encapsulates the active center and the polymerization occurs in the polymer
phase [127], this is even more so the case with supported (immobilized) catalysts.
Further consideration of the origin of different topologies caused by the process
conditions include heat and mass transfer effects. Heat and mass transfer limitations are
more easily present in the semi-batch slurry polymerizations, where residence times are
Table 6 Basic properties of metallocene copolymers and reference LDPE characterized with the
melt elongational measurements
Sample
Type
Density
(kg/m
3
)
M
a
w
(g/mol) M w /M n
η 0 (190
C)
(Pa s)
α (Â10
5
)
b
E a (average)
(kJ/mol)
C1b_P6
Linear
924
82,000 3.1
3,130
0.01
33
C1b_P5
Linear
922
106,000 3.3
7,970
0.1
32
C4_P1
LCB
925
94,000 3.3
16,600
1.2
34
C5_P2
LCB
960
83,000 4.7
10,200
1.4
39
C6_P7
LCB
930
82,000 7.5
25,000
3.2
44
LDPE
LDPE
923
155,000
c 15
b
7,600
53
Data from [120]
a
Values measured by SEC, uncorrected for branching effects
b
Fraction of long-chain branch points.Values for the constants in Equations 1–3 by Janzen and
Colby [106]: K ¼ 5.22 Â 10
À6 (Pa s)/(g/mol), B ¼ 6.0, M 0 ¼ 14.027 g/mol, M c ¼ 2,100 g/mol,
M Kuhn ¼ 145.9 g/mol
c
From SEC-on line viscometer, g
0 ¼ 0.5
208
J. Seppa ¨la ¨ et al.
few multiply branched chains? In the multiply branched case, differences in the
molecular weight between the branch points would determine the degree of nonlinearity and rate dependence of the extensional response. This being the case, the
polymer C4_P7 represents a more even distribution of the LCB than the C4_P1. An
alternative explanation, possibly acting simultaneously, could be differences in the
number of the branch points.
3.4.1 LCB Dependence on the Polymerization Process
The polymerization process should significantly be able to alter the LCB topology.
In a continuous system, such as the stirred tank reactor (CSTR) system, both
monomer and macromonomer concentrations are constant after the steady state
conditions are achieved. Monomer concentration is also constant in a semi-batch
polymerization with continuous monomer feed but the macromonomer concentration increases as the polymerization proceeds.
In solution polymerization, the forming polymer remains dissolved in the solution because the polymerization temperature is above the polymer melting point.
This allows for more free monomer and macromonomer mobility. Furthermore, in
the CSTR, residence times are typically short to overcome reduced catalyst lifetime
at higher temperatures [80, 82].
In slurry polymerization, the polymer precipitates from the solution partly or
totally and this certainly limits the macromer mobility. Forming polymer
encapsulates the active center and the polymerization occurs in the polymer
phase [127], this is even more so the case with supported (immobilized) catalysts.
Further consideration of the origin of different topologies caused by the process
conditions include heat and mass transfer effects. Heat and mass transfer limitations are
more easily present in the semi-batch slurry polymerizations, where residence times are
Table 6 Basic properties of metallocene copolymers and reference LDPE characterized with the
melt elongational measurements
Sample
Type
Density
(kg/m
3
)
M
a
w
(g/mol) M w /M n
η 0 (190
C)
(Pa s)
α (Â10
5
)
b
E a (average)
(kJ/mol)
C1b_P6
Linear
924
82,000 3.1
3,130
0.01
33
C1b_P5
Linear
922
106,000 3.3
7,970
0.1
32
C4_P1
LCB
925
94,000 3.3
16,600
1.2
34
C5_P2
LCB
960
83,000 4.7
10,200
1.4
39
C6_P7
LCB
930
82,000 7.5
25,000
3.2
44
LDPE
LDPE
923
155,000
c 15
b
7,600
53
Data from [120]
a
Values measured by SEC, uncorrected for branching effects
b
Fraction of long-chain branch points.Values for the constants in Equations 1–3 by Janzen and
Colby [106]: K ¼ 5.22 Â 10
À6 (Pa s)/(g/mol), B ¼ 6.0, M 0 ¼ 14.027 g/mol, M c ¼ 2,100 g/mol,
M Kuhn ¼ 145.9 g/mol
c
From SEC-on line viscometer, g
0 ¼ 0.5
208
J. Seppa ¨la ¨ et al.