

of additional energy barriers, but could be rather a consequence of an intrinsic
feature of diffusive barrier crossing with a fluctuating cantilever [149]. Figure 41a
schematically shows the assumed energy potential with idealized cusp-like barriers.
Stochastic analysis was carried out to propose parameters of a three-well-potential,
such as the location of the energy barriers q TA and q TB , the position of the
intermediate state q I , the height of the energy barriers V TA and V TB , and
the corresponding transition rates at zero force. Solution of the master equation
provides the force-dependent populations of the corresponding states:
d
dF
n x F
ð Þ ¼
dF
dt
À1
À
X
Y 6 ¼X
ð Þ
k XY F
ð Þn X F
ð Þ þ
X
Y 6 ¼X
ð Þ
k XY F
ð Þn Y
2
4
3
5
ð9Þ
where n X (F) is used to provide approximate values for the aforementioned parameters of the three-well-potential. This can be accomplished by fitting the
resulting probability distributions to the rupture and rejoining histograms recorded
at different loading rates (Fig. 41b, c). Optimization of parameters provided
locations for the first barrier at approximately q TA % 0.3 nm and the second at
q TB % 1.1 nm. The probability densities p(F) are plotted for a loading rate of
1,500 pN/s along with the experimental force histograms of rupture and rejoining
forces. The rupture force histogram displays two clear maxima corresponding to
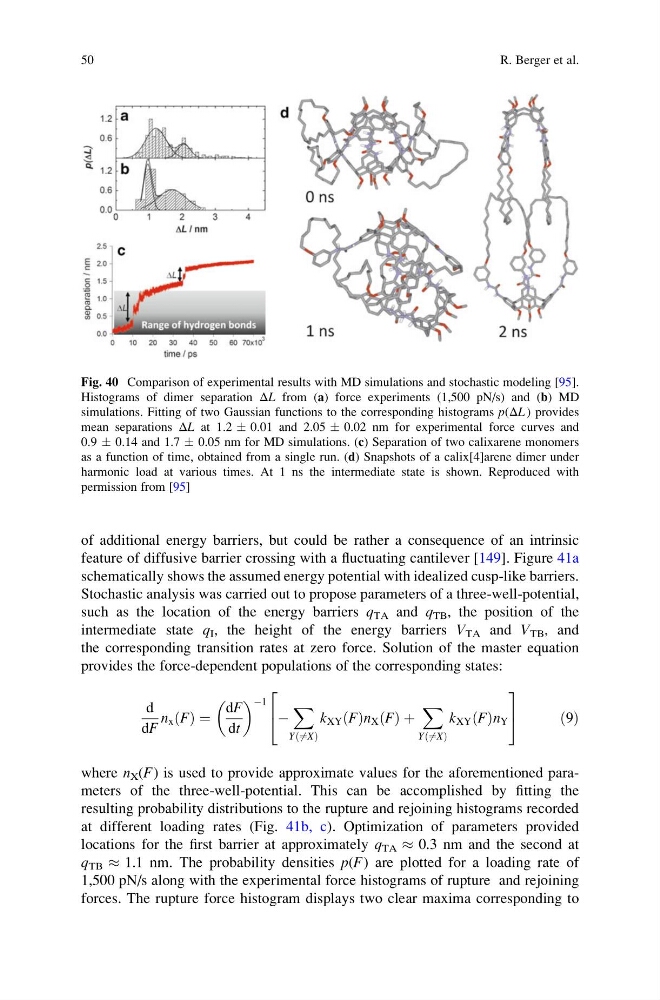
Fig. 40 Comparison of experimental results with MD simulations and stochastic modeling [95].
Histograms of dimer separation ΔL from (a) force experiments (1,500 pN/s) and (b) MD
simulations. Fitting of two Gaussian functions to the corresponding histograms p(ΔL ) provides
mean separations ΔL at 1.2 Æ 0.01 and 2.05 Æ 0.02 nm for experimental force curves and
0.9 Æ 0.14 and 1.7 Æ 0.05 nm for MD simulations. (c) Separation of two calixarene monomers
as a function of time, obtained from a single run. (d) Snapshots of a calix[4]arene dimer under
harmonic load at various times. At 1 ns the intermediate state is shown. Reproduced with
permission from [95]
50
R. Berger et al.
feature of diffusive barrier crossing with a fluctuating cantilever [149]. Figure 41a
schematically shows the assumed energy potential with idealized cusp-like barriers.
Stochastic analysis was carried out to propose parameters of a three-well-potential,
such as the location of the energy barriers q TA and q TB , the position of the
intermediate state q I , the height of the energy barriers V TA and V TB , and
the corresponding transition rates at zero force. Solution of the master equation
provides the force-dependent populations of the corresponding states:
d
dF
n x F
ð Þ ¼
dF
dt
À1
À
X
Y 6 ¼X
ð Þ
k XY F
ð Þn X F
ð Þ þ
X
Y 6 ¼X
ð Þ
k XY F
ð Þn Y
2
4
3
5
ð9Þ
where n X (F) is used to provide approximate values for the aforementioned parameters of the three-well-potential. This can be accomplished by fitting the
resulting probability distributions to the rupture and rejoining histograms recorded
at different loading rates (Fig. 41b, c). Optimization of parameters provided
locations for the first barrier at approximately q TA % 0.3 nm and the second at
q TB % 1.1 nm. The probability densities p(F) are plotted for a loading rate of
1,500 pN/s along with the experimental force histograms of rupture and rejoining
forces. The rupture force histogram displays two clear maxima corresponding to
Fig. 40 Comparison of experimental results with MD simulations and stochastic modeling [95].
Histograms of dimer separation ΔL from (a) force experiments (1,500 pN/s) and (b) MD
simulations. Fitting of two Gaussian functions to the corresponding histograms p(ΔL ) provides
mean separations ΔL at 1.2 Æ 0.01 and 2.05 Æ 0.02 nm for experimental force curves and
0.9 Æ 0.14 and 1.7 Æ 0.05 nm for MD simulations. (c) Separation of two calixarene monomers
as a function of time, obtained from a single run. (d) Snapshots of a calix[4]arene dimer under
harmonic load at various times. At 1 ns the intermediate state is shown. Reproduced with
permission from [95]
50
R. Berger et al.