

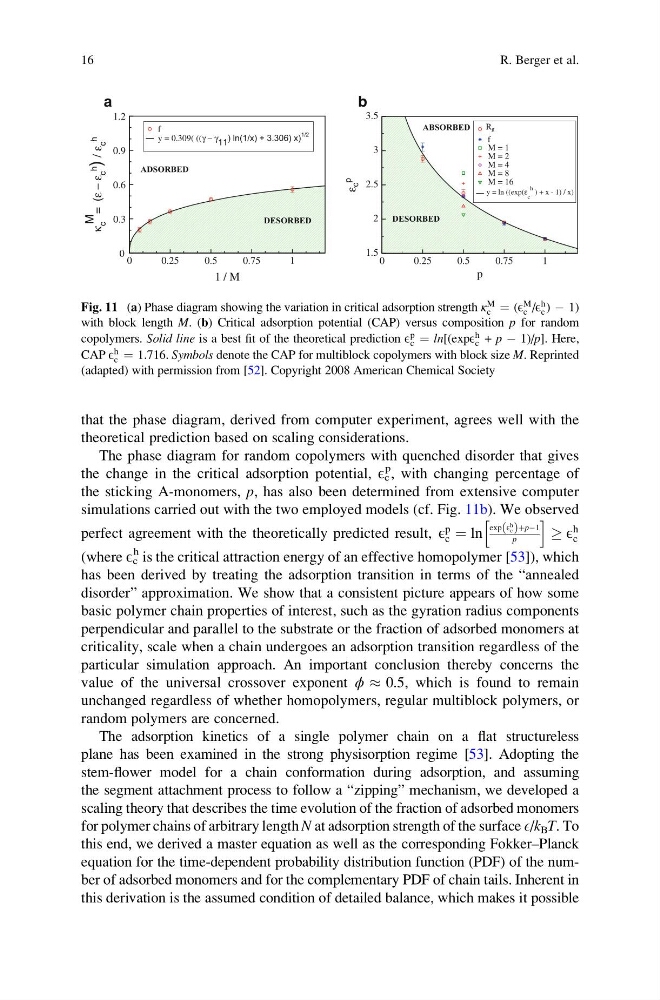
that the phase diagram, derived from computer experiment, agrees well with the
theoretical prediction based on scaling considerations.
The phase diagram for random copolymers with quenched disorder that gives
the change in the critical adsorption potential, E c
p , with changing percentage of
the sticking A-monomers, p, has also been determined from extensive computer
simulations carried out with the two employed models (cf. Fig. 11b). We observed
perfect agreement with the theoretically predicted result, E
p
c ¼ ln
exp E h
c
ð ÞþpÀ1
p
h
i
! E
h
c
(where E c
h is the critical attraction energy of an effective homopolymer [53]), which
has been derived by treating the adsorption transition in terms of the “annealed
disorder” approximation. We show that a consistent picture appears of how some
basic polymer chain properties of interest, such as the gyration radius components
perpendicular and parallel to the substrate or the fraction of adsorbed monomers at
criticality, scale when a chain undergoes an adsorption transition regardless of the
particular simulation approach. An important conclusion thereby concerns the
value of the universal crossover exponent ϕ % 0.5, which is found to remain
unchanged regardless of whether homopolymers, regular multiblock polymers, or
random polymers are concerned.
The adsorption kinetics of a single polymer chain on a flat structureless
plane has been examined in the strong physisorption regime [53]. Adopting the
stem-flower model for a chain conformation during adsorption, and assuming
the segment attachment process to follow a “zipping” mechanism, we developed a
scaling theory that describes the time evolution of the fraction of adsorbed monomers
for polymer chains of arbitrary length N at adsorption strength of the surface E/k B T. To
this end, we derived a master equation as well as the corresponding Fokker–Planck
equation for the time-dependent probability distribution function (PDF) of the number of adsorbed monomers and for the complementary PDF of chain tails. Inherent in
this derivation is the assumed condition of detailed balance, which makes it possible
0
0.25
0.5
0.75
1
1 / M
0
0.3
0.6
0.9
1.2
f
y = 0.309( ((γ − γ 11 ) ln(1/x) + 3.306) x)
1/2
ADSORBED
DESORBED
0
0.25
0.5
0.75
1
p
1.5
2
2.5
3
3.5
ε
c
p
Rg
f
M = 1
M = 2
M = 4
M = 8
M = 16
ABSORBED
DESORBED
M
κ
c
= (ε
− ε
c
h
) /
ε
c
h
y = ln ((exp(ε
c
h ) + x - 1) / x)
a
b
Fig. 11 (a) Phase diagram showing the variation in critical adsorption strength κ
M
c ¼ (E
M
c /E
h
c ) À 1)
with block length M. (b) Critical adsorption potential (CAP) versus composition p for random
copolymers. Solid line is a best fit of the theoretical prediction E
p
c ¼ ln[(expE
h
c + p À 1)/p]. Here,
CAP E
h
c ¼ 1.716. Symbols denote the CAP for multiblock copolymers with block size M. Reprinted
(adapted) with permission from [52]. Copyright 2008 American Chemical Society
16
R. Berger et al.
theoretical prediction based on scaling considerations.
The phase diagram for random copolymers with quenched disorder that gives
the change in the critical adsorption potential, E c
p , with changing percentage of
the sticking A-monomers, p, has also been determined from extensive computer
simulations carried out with the two employed models (cf. Fig. 11b). We observed
perfect agreement with the theoretically predicted result, E
p
c ¼ ln
exp E h
c
ð ÞþpÀ1
p
h
i
! E
h
c
(where E c
h is the critical attraction energy of an effective homopolymer [53]), which
has been derived by treating the adsorption transition in terms of the “annealed
disorder” approximation. We show that a consistent picture appears of how some
basic polymer chain properties of interest, such as the gyration radius components
perpendicular and parallel to the substrate or the fraction of adsorbed monomers at
criticality, scale when a chain undergoes an adsorption transition regardless of the
particular simulation approach. An important conclusion thereby concerns the
value of the universal crossover exponent ϕ % 0.5, which is found to remain
unchanged regardless of whether homopolymers, regular multiblock polymers, or
random polymers are concerned.
The adsorption kinetics of a single polymer chain on a flat structureless
plane has been examined in the strong physisorption regime [53]. Adopting the
stem-flower model for a chain conformation during adsorption, and assuming
the segment attachment process to follow a “zipping” mechanism, we developed a
scaling theory that describes the time evolution of the fraction of adsorbed monomers
for polymer chains of arbitrary length N at adsorption strength of the surface E/k B T. To
this end, we derived a master equation as well as the corresponding Fokker–Planck
equation for the time-dependent probability distribution function (PDF) of the number of adsorbed monomers and for the complementary PDF of chain tails. Inherent in
this derivation is the assumed condition of detailed balance, which makes it possible
0
0.25
0.5
0.75
1
1 / M
0
0.3
0.6
0.9
1.2
f
y = 0.309( ((γ − γ 11 ) ln(1/x) + 3.306) x)
1/2
ADSORBED
DESORBED
0
0.25
0.5
0.75
1
p
1.5
2
2.5
3
3.5
ε
c
p
Rg
f
M = 1
M = 2
M = 4
M = 8
M = 16
ABSORBED
DESORBED
M
κ
c
= (ε
− ε
c
h
) /
ε
c
h
y = ln ((exp(ε
c
h ) + x - 1) / x)
a
b
Fig. 11 (a) Phase diagram showing the variation in critical adsorption strength κ
M
c ¼ (E
M
c /E
h
c ) À 1)
with block length M. (b) Critical adsorption potential (CAP) versus composition p for random
copolymers. Solid line is a best fit of the theoretical prediction E
p
c ¼ ln[(expE
h
c + p À 1)/p]. Here,
CAP E
h
c ¼ 1.716. Symbols denote the CAP for multiblock copolymers with block size M. Reprinted
(adapted) with permission from [52]. Copyright 2008 American Chemical Society
16
R. Berger et al.