

3.6 Complex Formation of Polymer Brushes
The same interactions that dominate the shape of complex macromolecules are also
responsible for the formation of defined aggregates and for the adsorption to
surfaces, which is described in Section 3.9. As one example, cylindrical brushes
are again described. The interaction of side groups with the solvent determines the
structure of the macromolecules and the interactions between them as well as with
surfaces.
Poor solvent conditions for the side chains grafted to, e.g., a linear polymer
(bottle brushes) will lead to intermolecular aggregation; however, interestingly,
they can also lead to intramolecular microphase separation within a homopolymer
chain. Consider a bottle brush polymer with a very stiff backbone (in the
simulations [92] it was modeled as a rigid rod) placed into poor solvent conditions.
The resulting structures then depend on solvent quality and grafting density of the
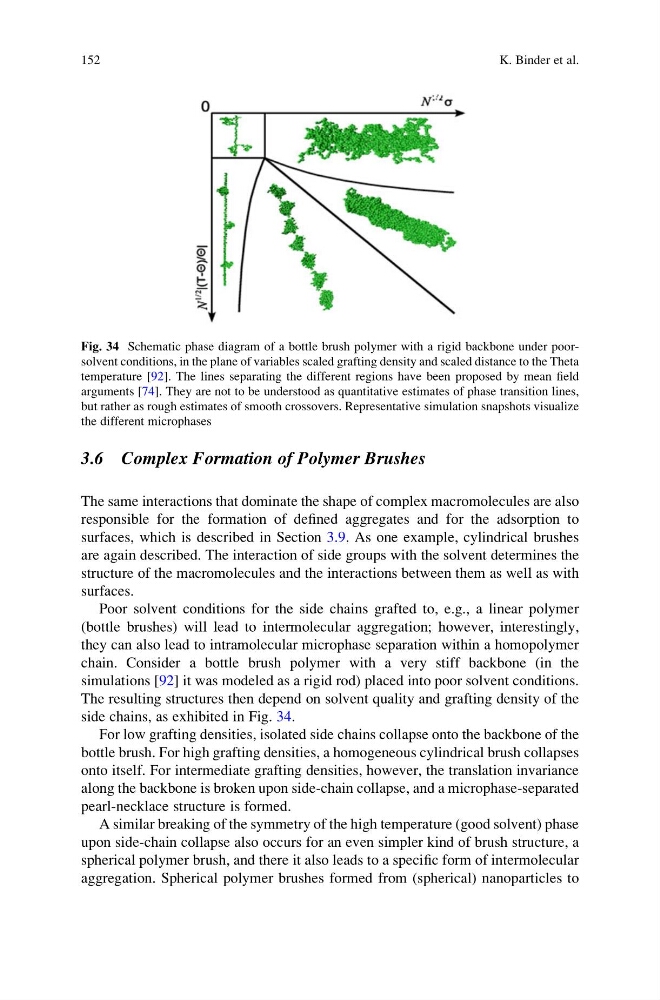
side chains, as exhibited in Fig. 34.
For low grafting densities, isolated side chains collapse onto the backbone of the
bottle brush. For high grafting densities, a homogeneous cylindrical brush collapses
onto itself. For intermediate grafting densities, however, the translation invariance
along the backbone is broken upon side-chain collapse, and a microphase-separated
pearl-necklace structure is formed.
A similar breaking of the symmetry of the high temperature (good solvent) phase
upon side-chain collapse also occurs for an even simpler kind of brush structure, a
spherical polymer brush, and there it also leads to a specific form of intermolecular
aggregation. Spherical polymer brushes formed from (spherical) nanoparticles to
Fig. 34 Schematic phase diagram of a bottle brush polymer with a rigid backbone under poorsolvent conditions, in the plane of variables scaled grafting density and scaled distance to the Theta
temperature [92]. The lines separating the different regions have been proposed by mean field
arguments [74]. They are not to be understood as quantitative estimates of phase transition lines,
but rather as rough estimates of smooth crossovers. Representative simulation snapshots visualize
the different microphases
152
K. Binder et al.
The same interactions that dominate the shape of complex macromolecules are also
responsible for the formation of defined aggregates and for the adsorption to
surfaces, which is described in Section 3.9. As one example, cylindrical brushes
are again described. The interaction of side groups with the solvent determines the
structure of the macromolecules and the interactions between them as well as with
surfaces.
Poor solvent conditions for the side chains grafted to, e.g., a linear polymer
(bottle brushes) will lead to intermolecular aggregation; however, interestingly,
they can also lead to intramolecular microphase separation within a homopolymer
chain. Consider a bottle brush polymer with a very stiff backbone (in the
simulations [92] it was modeled as a rigid rod) placed into poor solvent conditions.
The resulting structures then depend on solvent quality and grafting density of the
side chains, as exhibited in Fig. 34.
For low grafting densities, isolated side chains collapse onto the backbone of the
bottle brush. For high grafting densities, a homogeneous cylindrical brush collapses
onto itself. For intermediate grafting densities, however, the translation invariance
along the backbone is broken upon side-chain collapse, and a microphase-separated
pearl-necklace structure is formed.
A similar breaking of the symmetry of the high temperature (good solvent) phase
upon side-chain collapse also occurs for an even simpler kind of brush structure, a
spherical polymer brush, and there it also leads to a specific form of intermolecular
aggregation. Spherical polymer brushes formed from (spherical) nanoparticles to
Fig. 34 Schematic phase diagram of a bottle brush polymer with a rigid backbone under poorsolvent conditions, in the plane of variables scaled grafting density and scaled distance to the Theta
temperature [92]. The lines separating the different regions have been proposed by mean field
arguments [74]. They are not to be understood as quantitative estimates of phase transition lines,
but rather as rough estimates of smooth crossovers. Representative simulation snapshots visualize
the different microphases
152
K. Binder et al.