

increasing SDS/lysine ratio (Fig. 19). For a molar ratio SDS/lysine >4, aggregation
and eventually precipitation was observed.
Unfortunately, quantitative light scattering results could not trace the effect of
the coil-to-helix side chain transition on the main chain conformation, because the
concomitant increase in ionic strength has a larger impact on the overall
dimensions, i.e., leads to a significant decrease. Like many other polyelectrolytes,
CB-PLL55 approaches the phase boundary at high ionic strength (“salting out”),
which is known to depend on specific interactions with the added salt. This
attraction at high salt is qualitatively confirmed by AFM pictures, which show
strongly curved cylinders in both NaBr and NaClO 4 solutions, which is a clear
indication of intramolecular attraction.
In contrast, the AFM pictures as well as cryo-TEM of sample CB-PLL55 prepared
from 5 mM NaBr aqueous solution (Fig. 20) show extended cylinders. The cylinders
exhibit undulations of the cross-section that are reminiscent of the “pinned clusters”
[74, 91] postulated by scaling arguments. The occurrence of pearl-necklace-type
structures, where pinned clusters of side chains alternate with regimes that are almost
free of side chains, has also been seen in simulations of bottlebrushes, provided one
has poor solvent conditions. These clusters are formed by collective collapse of
several neighboring side chains [92]. We return to this problem in Sect. 3.5.
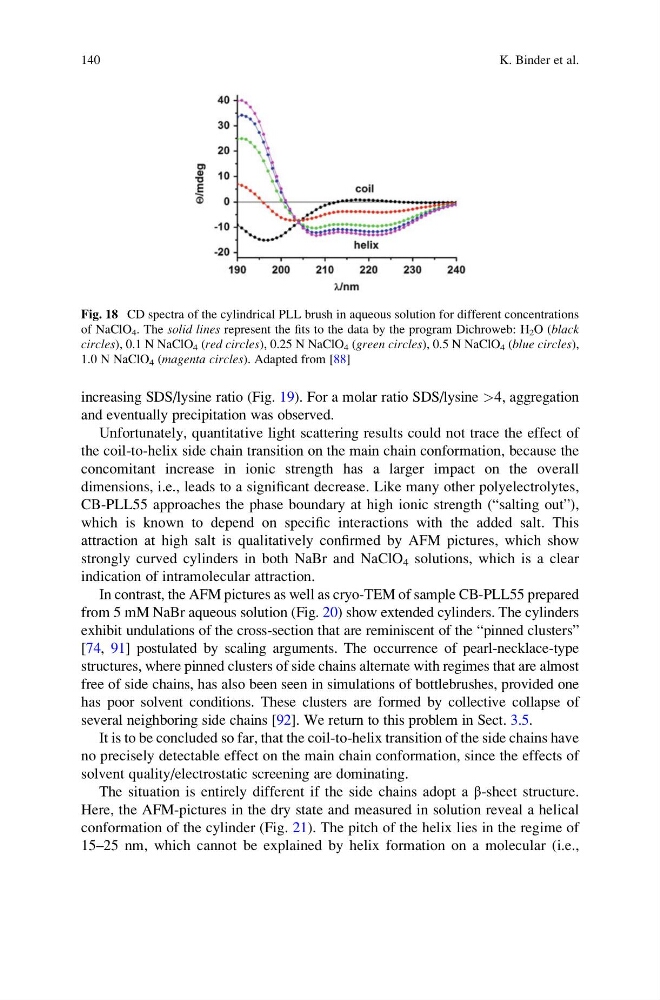
It is to be concluded so far, that the coil-to-helix transition of the side chains have
no precisely detectable effect on the main chain conformation, since the effects of
solvent quality/electrostatic screening are dominating.
The situation is entirely different if the side chains adopt a β-sheet structure.
Here, the AFM-pictures in the dry state and measured in solution reveal a helical
conformation of the cylinder (Fig. 21). The pitch of the helix lies in the regime of
15–25 nm, which cannot be explained by helix formation on a molecular (i.e.,
Fig. 18 CD spectra of the cylindrical PLL brush in aqueous solution for different concentrations
of NaClO 4 . The solid lines represent the fits to the data by the program Dichroweb: H 2 O (black
circles), 0.1 N NaClO 4 (red circles), 0.25 N NaClO 4 (green circles), 0.5 N NaClO 4 (blue circles),
1.0 N NaClO 4 (magenta circles). Adapted from [88]
140
K. Binder et al.
and eventually precipitation was observed.
Unfortunately, quantitative light scattering results could not trace the effect of
the coil-to-helix side chain transition on the main chain conformation, because the
concomitant increase in ionic strength has a larger impact on the overall
dimensions, i.e., leads to a significant decrease. Like many other polyelectrolytes,
CB-PLL55 approaches the phase boundary at high ionic strength (“salting out”),
which is known to depend on specific interactions with the added salt. This
attraction at high salt is qualitatively confirmed by AFM pictures, which show
strongly curved cylinders in both NaBr and NaClO 4 solutions, which is a clear
indication of intramolecular attraction.
In contrast, the AFM pictures as well as cryo-TEM of sample CB-PLL55 prepared
from 5 mM NaBr aqueous solution (Fig. 20) show extended cylinders. The cylinders
exhibit undulations of the cross-section that are reminiscent of the “pinned clusters”
[74, 91] postulated by scaling arguments. The occurrence of pearl-necklace-type
structures, where pinned clusters of side chains alternate with regimes that are almost
free of side chains, has also been seen in simulations of bottlebrushes, provided one
has poor solvent conditions. These clusters are formed by collective collapse of
several neighboring side chains [92]. We return to this problem in Sect. 3.5.
It is to be concluded so far, that the coil-to-helix transition of the side chains have
no precisely detectable effect on the main chain conformation, since the effects of
solvent quality/electrostatic screening are dominating.
The situation is entirely different if the side chains adopt a β-sheet structure.
Here, the AFM-pictures in the dry state and measured in solution reveal a helical
conformation of the cylinder (Fig. 21). The pitch of the helix lies in the regime of
15–25 nm, which cannot be explained by helix formation on a molecular (i.e.,
Fig. 18 CD spectra of the cylindrical PLL brush in aqueous solution for different concentrations
of NaClO 4 . The solid lines represent the fits to the data by the program Dichroweb: H 2 O (black
circles), 0.1 N NaClO 4 (red circles), 0.25 N NaClO 4 (green circles), 0.5 N NaClO 4 (blue circles),
1.0 N NaClO 4 (magenta circles). Adapted from [88]
140
K. Binder et al.