

σ calc ¼
p
e
2
s
6πη
1
r þ þ
1
r À
(2)
Here, η is the viscosity of the surrounding liquid, r
+/À are the ionic radii, and p s is
the total ion concentration from the stoichiometry. The measured DC conductivity
differs from the calculated conductivity because the paired charges do not contribute
to the current.
Further information is provided by diffusion-ordered spectroscopy (DOSY)NMR. With DOSY-NMR the diffusion coefficient, D exp , can be measured. The
measured diffusion coefficients, however, are not the diffusion coefficients of the
free ions. They represent some average of the fully dissociated and paired states.
Nevertheless, knowledge of the measured (NMR) diffusion coefficients together
with the degree of ion dissociation allows calculation of the diffusion coefficients of
the free ions [21].
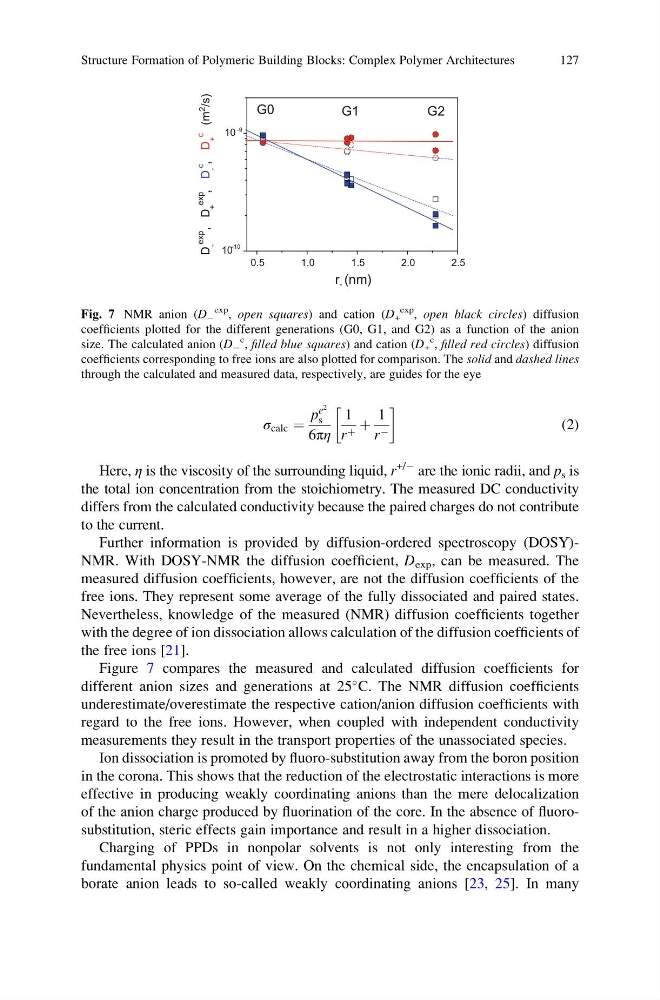
Figure 7 compares the measured and calculated diffusion coefficients for
different anion sizes and generations at 25
C. The NMR diffusion coefficients
underestimate/overestimate the respective cation/anion diffusion coefficients with
regard to the free ions. However, when coupled with independent conductivity
measurements they result in the transport properties of the unassociated species.
Ion dissociation is promoted by fluoro-substitution away from the boron position
in the corona. This shows that the reduction of the electrostatic interactions is more
effective in producing weakly coordinating anions than the mere delocalization
of the anion charge produced by fluorination of the core. In the absence of fluorosubstitution, steric effects gain importance and result in a higher dissociation.
Charging of PPDs in nonpolar solvents is not only interesting from the
fundamental physics point of view. On the chemical side, the encapsulation of a
borate anion leads to so-called weakly coordinating anions [23, 25]. In many
0.5
1.0
1.5
2.0
2.5
10
-10
10
-9
G2
G1
G0
D
-
exp
, D
+
exp
, D
-
c
, D
+
c
(m
2
/s)
r - (nm)
Fig. 7 NMR anion (D À
exp
, open squares) and cation (D +
exp
, open black circles) diffusion
coefficients plotted for the different generations (G0, G1, and G2) as a function of the anion
size. The calculated anion (D À
c
, filled blue squares) and cation (D +
c , filled red circles) diffusion
coefficients corresponding to free ions are also plotted for comparison. The solid and dashed lines
through the calculated and measured data, respectively, are guides for the eye
Structure Formation of Polymeric Building Blocks: Complex Polymer Architectures
127
p
e
2
s
6πη
1
r þ þ
1
r À
(2)
Here, η is the viscosity of the surrounding liquid, r
+/À are the ionic radii, and p s is
the total ion concentration from the stoichiometry. The measured DC conductivity
differs from the calculated conductivity because the paired charges do not contribute
to the current.
Further information is provided by diffusion-ordered spectroscopy (DOSY)NMR. With DOSY-NMR the diffusion coefficient, D exp , can be measured. The
measured diffusion coefficients, however, are not the diffusion coefficients of the
free ions. They represent some average of the fully dissociated and paired states.
Nevertheless, knowledge of the measured (NMR) diffusion coefficients together
with the degree of ion dissociation allows calculation of the diffusion coefficients of
the free ions [21].
Figure 7 compares the measured and calculated diffusion coefficients for
different anion sizes and generations at 25
C. The NMR diffusion coefficients
underestimate/overestimate the respective cation/anion diffusion coefficients with
regard to the free ions. However, when coupled with independent conductivity
measurements they result in the transport properties of the unassociated species.
Ion dissociation is promoted by fluoro-substitution away from the boron position
in the corona. This shows that the reduction of the electrostatic interactions is more
effective in producing weakly coordinating anions than the mere delocalization
of the anion charge produced by fluorination of the core. In the absence of fluorosubstitution, steric effects gain importance and result in a higher dissociation.
Charging of PPDs in nonpolar solvents is not only interesting from the
fundamental physics point of view. On the chemical side, the encapsulation of a
borate anion leads to so-called weakly coordinating anions [23, 25]. In many
0.5
1.0
1.5
2.0
2.5
10
-10
10
-9
G2
G1
G0
D
-
exp
, D
+
exp
, D
-
c
, D
+
c
(m
2
/s)
r - (nm)
Fig. 7 NMR anion (D À
exp
, open squares) and cation (D +
exp
, open black circles) diffusion
coefficients plotted for the different generations (G0, G1, and G2) as a function of the anion
size. The calculated anion (D À
c
, filled blue squares) and cation (D +
c , filled red circles) diffusion
coefficients corresponding to free ions are also plotted for comparison. The solid and dashed lines
through the calculated and measured data, respectively, are guides for the eye
Structure Formation of Polymeric Building Blocks: Complex Polymer Architectures
127