

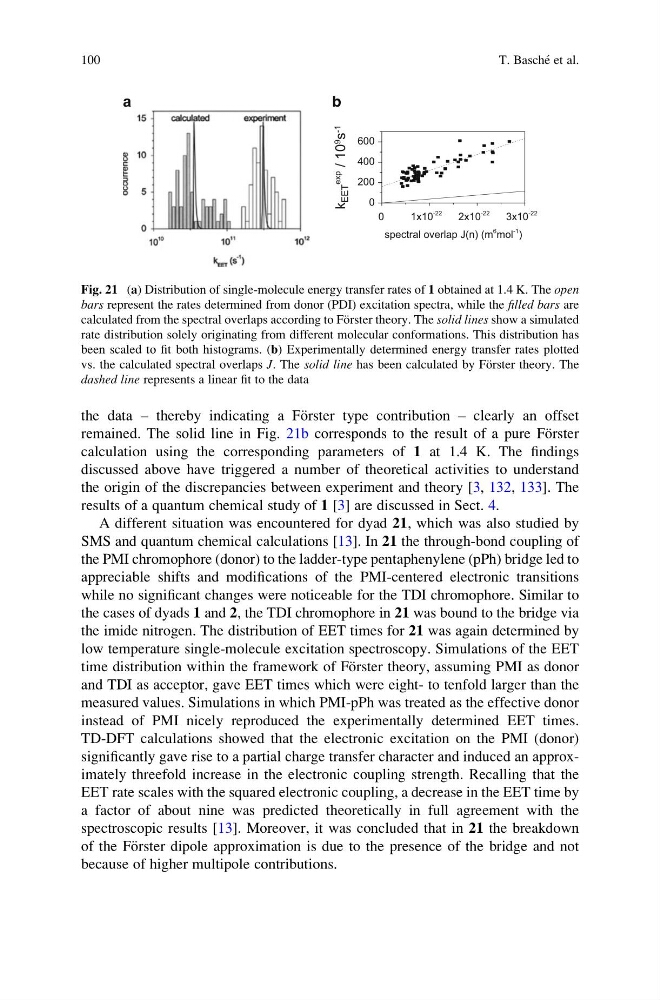
the data – thereby indicating a Fo ¨rster type contribution – clearly an offset
remained. The solid line in Fig. 21b corresponds to the result of a pure Fo ¨rster
calculation using the corresponding parameters of 1 at 1.4 K. The findings
discussed above have triggered a number of theoretical activities to understand
the origin of the discrepancies between experiment and theory [3, 132, 133]. The
results of a quantum chemical study of 1 [3] are discussed in Sect. 4.
A different situation was encountered for dyad 21, which was also studied by
SMS and quantum chemical calculations [13]. In 21 the through-bond coupling of
the PMI chromophore (donor) to the ladder-type pentaphenylene (pPh) bridge led to
appreciable shifts and modifications of the PMI-centered electronic transitions
while no significant changes were noticeable for the TDI chromophore. Similar to
the cases of dyads 1 and 2, the TDI chromophore in 21 was bound to the bridge via
the imide nitrogen. The distribution of EET times for 21 was again determined by
low temperature single-molecule excitation spectroscopy. Simulations of the EET
time distribution within the framework of Fo ¨rster theory, assuming PMI as donor
and TDI as acceptor, gave EET times which were eight- to tenfold larger than the
measured values. Simulations in which PMI-pPh was treated as the effective donor
instead of PMI nicely reproduced the experimentally determined EET times.
TD-DFT calculations showed that the electronic excitation on the PMI (donor)
significantly gave rise to a partial charge transfer character and induced an approximately threefold increase in the electronic coupling strength. Recalling that the
EET rate scales with the squared electronic coupling, a decrease in the EET time by
a factor of about nine was predicted theoretically in full agreement with the
spectroscopic results [13]. Moreover, it was concluded that in 21 the breakdown
of the Fo ¨rster dipole approximation is due to the presence of the bridge and not
because of higher multipole contributions.
0
1x10
-22
2x10
-22
3x10
-22
0
200
400
600
spectral overlap J(n) (m
6 mol
-1 )
k
EET
exp
/ 10
9
s
-1
a
b
Fig. 21 (a) Distribution of single-molecule energy transfer rates of 1 obtained at 1.4 K. The open
bars represent the rates determined from donor (PDI) excitation spectra, while the filled bars are
calculated from the spectral overlaps according to Fo ¨rster theory. The solid lines show a simulated
rate distribution solely originating from different molecular conformations. This distribution has
been scaled to fit both histograms. (b) Experimentally determined energy transfer rates plotted
vs. the calculated spectral overlaps J. The solid line has been calculated by Fo ¨rster theory. The
dashed line represents a linear fit to the data
100
T. Basche ´ et al.
remained. The solid line in Fig. 21b corresponds to the result of a pure Fo ¨rster
calculation using the corresponding parameters of 1 at 1.4 K. The findings
discussed above have triggered a number of theoretical activities to understand
the origin of the discrepancies between experiment and theory [3, 132, 133]. The
results of a quantum chemical study of 1 [3] are discussed in Sect. 4.
A different situation was encountered for dyad 21, which was also studied by
SMS and quantum chemical calculations [13]. In 21 the through-bond coupling of
the PMI chromophore (donor) to the ladder-type pentaphenylene (pPh) bridge led to
appreciable shifts and modifications of the PMI-centered electronic transitions
while no significant changes were noticeable for the TDI chromophore. Similar to
the cases of dyads 1 and 2, the TDI chromophore in 21 was bound to the bridge via
the imide nitrogen. The distribution of EET times for 21 was again determined by
low temperature single-molecule excitation spectroscopy. Simulations of the EET
time distribution within the framework of Fo ¨rster theory, assuming PMI as donor
and TDI as acceptor, gave EET times which were eight- to tenfold larger than the
measured values. Simulations in which PMI-pPh was treated as the effective donor
instead of PMI nicely reproduced the experimentally determined EET times.
TD-DFT calculations showed that the electronic excitation on the PMI (donor)
significantly gave rise to a partial charge transfer character and induced an approximately threefold increase in the electronic coupling strength. Recalling that the
EET rate scales with the squared electronic coupling, a decrease in the EET time by
a factor of about nine was predicted theoretically in full agreement with the
spectroscopic results [13]. Moreover, it was concluded that in 21 the breakdown
of the Fo ¨rster dipole approximation is due to the presence of the bridge and not
because of higher multipole contributions.
0
1x10
-22
2x10
-22
3x10
-22
0
200
400
600
spectral overlap J(n) (m
6 mol
-1 )
k
EET
exp
/ 10
9
s
-1
a
b
Fig. 21 (a) Distribution of single-molecule energy transfer rates of 1 obtained at 1.4 K. The open
bars represent the rates determined from donor (PDI) excitation spectra, while the filled bars are
calculated from the spectral overlaps according to Fo ¨rster theory. The solid lines show a simulated
rate distribution solely originating from different molecular conformations. This distribution has
been scaled to fit both histograms. (b) Experimentally determined energy transfer rates plotted
vs. the calculated spectral overlaps J. The solid line has been calculated by Fo ¨rster theory. The
dashed line represents a linear fit to the data
100
T. Basche ´ et al.