

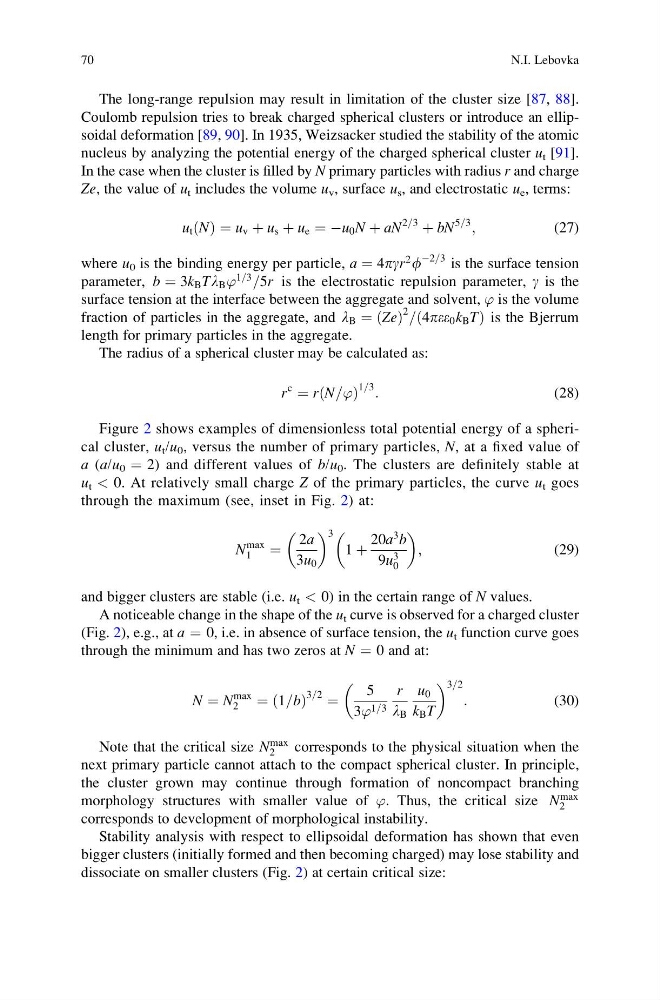
The long-range repulsion may result in limitation of the cluster size [87, 88].
Coulomb repulsion tries to break charged spherical clusters or introduce an ellipsoidal deformation [89, 90]. In 1935, Weizsacker studied the stability of the atomic
nucleus by analyzing the potential energy of the charged spherical cluster u t [91].
In the case when the cluster is filled by N primary particles with radius r and charge
Ze, the value of u t includes the volume u v , surface u s , and electrostatic u e , terms:
u t ðNÞ ¼ u v þ u s þ u e ¼ Àu 0 N þ aN
2=3
þ bN
5=3
;
(27)
where u 0 is the binding energy per particle, a ¼ 4pgr
2 f
À2=3 is the surface tension
parameter, b ¼ 3k B Tl B ’
1=3
=5r is the electrostatic repulsion parameter, g is the
surface tension at the interface between the aggregate and solvent, ’ is the volume
fraction of particles in the aggregate, and l B ¼ Ze
ð Þ
2 = 4pee 0 k B T
ð
Þis the Bjerrum
length for primary particles in the aggregate.
The radius of a spherical cluster may be calculated as:
r
c
¼ r N=’
ð
Þ
1=3 :
(28)
Figure 2 shows examples of dimensionless total potential energy of a spherical cluster, u t /u 0 , versus the number of primary particles, N, at a fixed value of
a (a/u 0 ¼ 2) and different values of b/u 0 . The clusters are definitely stable at
u t < 0. At relatively small charge Z of the primary particles, the curve u t goes
through the maximum (see, inset in Fig. 2) at:
N
max
1
¼
2a
3u 0
3
1 þ
20a
3 b
9u
3
0
;
(29)
and bigger clusters are stable (i.e. u t < 0) in the certain range of N values.
A noticeable change in the shape of the u t curve is observed for a charged cluster
(Fig. 2), e.g., at a ¼ 0, i.e. in absence of surface tension, the u t function curve goes
through the minimum and has two zeros at N ¼ 0 and at:
N ¼ N
max
2
¼ 1=b
ð
Þ
3=2 ¼
5
3’ 1=3
r
l B
u 0
k B T
3=2
:
(30)
Note that the critical size N
max
2
corresponds to the physical situation when the
next primary particle cannot attach to the compact spherical cluster. In principle,
the cluster grown may continue through formation of noncompact branching
morphology structures with smaller value of ’. Thus, the critical size N
max
2
corresponds to development of morphological instability.
Stability analysis with respect to ellipsoidal deformation has shown that even
bigger clusters (initially formed and then becoming charged) may lose stability and
dissociate on smaller clusters (Fig. 2) at certain critical size:
70
N.I. Lebovka
Coulomb repulsion tries to break charged spherical clusters or introduce an ellipsoidal deformation [89, 90]. In 1935, Weizsacker studied the stability of the atomic
nucleus by analyzing the potential energy of the charged spherical cluster u t [91].
In the case when the cluster is filled by N primary particles with radius r and charge
Ze, the value of u t includes the volume u v , surface u s , and electrostatic u e , terms:
u t ðNÞ ¼ u v þ u s þ u e ¼ Àu 0 N þ aN
2=3
þ bN
5=3
;
(27)
where u 0 is the binding energy per particle, a ¼ 4pgr
2 f
À2=3 is the surface tension
parameter, b ¼ 3k B Tl B ’
1=3
=5r is the electrostatic repulsion parameter, g is the
surface tension at the interface between the aggregate and solvent, ’ is the volume
fraction of particles in the aggregate, and l B ¼ Ze
ð Þ
2 = 4pee 0 k B T
ð
Þis the Bjerrum
length for primary particles in the aggregate.
The radius of a spherical cluster may be calculated as:
r
c
¼ r N=’
ð
Þ
1=3 :
(28)
Figure 2 shows examples of dimensionless total potential energy of a spherical cluster, u t /u 0 , versus the number of primary particles, N, at a fixed value of
a (a/u 0 ¼ 2) and different values of b/u 0 . The clusters are definitely stable at
u t < 0. At relatively small charge Z of the primary particles, the curve u t goes
through the maximum (see, inset in Fig. 2) at:
N
max
1
¼
2a
3u 0
3
1 þ
20a
3 b
9u
3
0
;
(29)
and bigger clusters are stable (i.e. u t < 0) in the certain range of N values.
A noticeable change in the shape of the u t curve is observed for a charged cluster
(Fig. 2), e.g., at a ¼ 0, i.e. in absence of surface tension, the u t function curve goes
through the minimum and has two zeros at N ¼ 0 and at:
N ¼ N
max
2
¼ 1=b
ð
Þ
3=2 ¼
5
3’ 1=3
r
l B
u 0
k B T
3=2
:
(30)
Note that the critical size N
max
2
corresponds to the physical situation when the
next primary particle cannot attach to the compact spherical cluster. In principle,
the cluster grown may continue through formation of noncompact branching
morphology structures with smaller value of ’. Thus, the critical size N
max
2
corresponds to development of morphological instability.
Stability analysis with respect to ellipsoidal deformation has shown that even
bigger clusters (initially formed and then becoming charged) may lose stability and
dissociate on smaller clusters (Fig. 2) at certain critical size:
70
N.I. Lebovka