

protein molecules (system B) and one for incorporating positively charged protein
molecules (system A), were investigated to assess whether the order of mixing was
important. These systems were PAA 42 -PAAm 417 , PDMAEMA 150 and lysozyme
and PAA 139 (system A), and a-lactalbumin and quarternised poly(2-vinyl
pyridinium) 41 -block-poly(ethylene oxide) 205 (P2MVP 41 -PEO 205 ) (system B). The
two protein molecules lysozyme and a-lactalbumin are similar in size but oppositely charged at pH 7 [65]. The pH during these measurements was fixed at 7 using
a phosphate buffer [50]. First, light scattering titrations were performed, starting at
F
À
¼ 0 and F
À
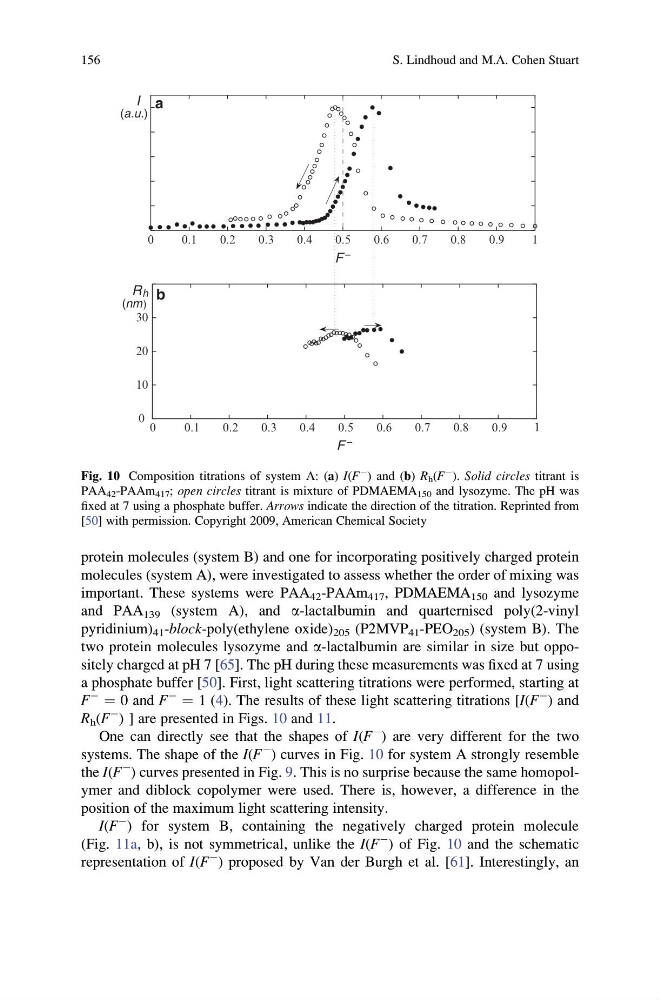
¼ 1 (4). The results of these light scattering titrations [I(F
À ) and
R h (F
À ) ] are presented in Figs. 10 and 11.
One can directly see that the shapes of I(F
À ) are very different for the two
systems. The shape of the I(F
À
) curves in Fig. 10 for system A strongly resemble
the I(F
À ) curves presented in Fig. 9. This is no surprise because the same homopolymer and diblock copolymer were used. There is, however, a difference in the
position of the maximum light scattering intensity.
I(F
À ) for system B, containing the negatively charged protein molecule
(Fig. 11a, b), is not symmetrical, unlike the I(F
À
) of Fig. 10 and the schematic
representation of I(F
À ) proposed by Van der Burgh et al. [61]. Interestingly, an
0
0.1
0.2
0.3
0.4
0.5
0.6
0.7
0.8
0.9
1
F −
0
0.1
0.2
0.3
0.4
0.5
0.6
0.7
0.8
0.9
1
0
10
20
30
F −
a
b
I
R h
(a.u.)
(nm)
Fig. 10 Composition titrations of system A: (a) I(F
À ) and (b) R h (F
À ). Solid circles titrant is
PAA 42 -PAAm 417 ; open circles titrant is mixture of PDMAEMA 150 and lysozyme. The pH was
fixed at 7 using a phosphate buffer. Arrows indicate the direction of the titration. Reprinted from
[50] with permission. Copyright 2009, American Chemical Society
156
S. Lindhoud and M.A. Cohen Stuart
molecules (system A), were investigated to assess whether the order of mixing was
important. These systems were PAA 42 -PAAm 417 , PDMAEMA 150 and lysozyme
and PAA 139 (system A), and a-lactalbumin and quarternised poly(2-vinyl
pyridinium) 41 -block-poly(ethylene oxide) 205 (P2MVP 41 -PEO 205 ) (system B). The
two protein molecules lysozyme and a-lactalbumin are similar in size but oppositely charged at pH 7 [65]. The pH during these measurements was fixed at 7 using
a phosphate buffer [50]. First, light scattering titrations were performed, starting at
F
À
¼ 0 and F
À
¼ 1 (4). The results of these light scattering titrations [I(F
À ) and
R h (F
À ) ] are presented in Figs. 10 and 11.
One can directly see that the shapes of I(F
À ) are very different for the two
systems. The shape of the I(F
À
) curves in Fig. 10 for system A strongly resemble
the I(F
À ) curves presented in Fig. 9. This is no surprise because the same homopolymer and diblock copolymer were used. There is, however, a difference in the
position of the maximum light scattering intensity.
I(F
À ) for system B, containing the negatively charged protein molecule
(Fig. 11a, b), is not symmetrical, unlike the I(F
À
) of Fig. 10 and the schematic
representation of I(F
À ) proposed by Van der Burgh et al. [61]. Interestingly, an
0
0.1
0.2
0.3
0.4
0.5
0.6
0.7
0.8
0.9
1
F −
0
0.1
0.2
0.3
0.4
0.5
0.6
0.7
0.8
0.9
1
0
10
20
30
F −
a
b
I
R h
(a.u.)
(nm)
Fig. 10 Composition titrations of system A: (a) I(F
À ) and (b) R h (F
À ). Solid circles titrant is
PAA 42 -PAAm 417 ; open circles titrant is mixture of PDMAEMA 150 and lysozyme. The pH was
fixed at 7 using a phosphate buffer. Arrows indicate the direction of the titration. Reprinted from
[50] with permission. Copyright 2009, American Chemical Society
156
S. Lindhoud and M.A. Cohen Stuart