

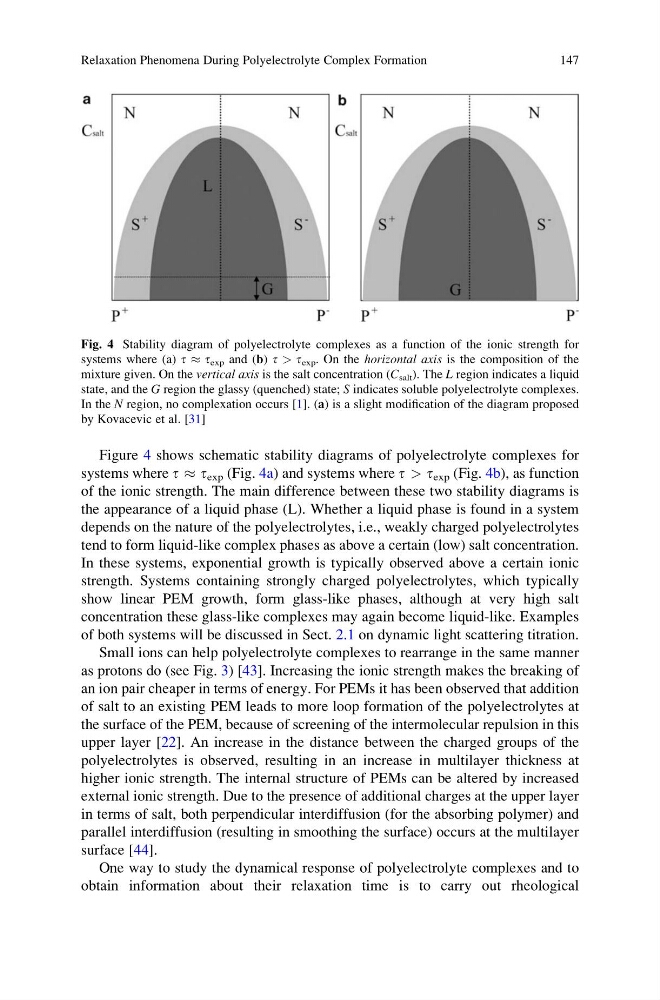
Figure 4 shows schematic stability diagrams of polyelectrolyte complexes for
systems where t % t exp (Fig. 4a) and systems where t > t exp (Fig. 4b), as function
of the ionic strength. The main difference between these two stability diagrams is
the appearance of a liquid phase (L). Whether a liquid phase is found in a system
depends on the nature of the polyelectrolytes, i.e., weakly charged polyelectrolytes
tend to form liquid-like complex phases as above a certain (low) salt concentration.
In these systems, exponential growth is typically observed above a certain ionic
strength. Systems containing strongly charged polyelectrolytes, which typically
show linear PEM growth, form glass-like phases, although at very high salt
concentration these glass-like complexes may again become liquid-like. Examples
of both systems will be discussed in Sect. 2.1 on dynamic light scattering titration.
Small ions can help polyelectrolyte complexes to rearrange in the same manner
as protons do (see Fig. 3) [43]. Increasing the ionic strength makes the breaking of
an ion pair cheaper in terms of energy. For PEMs it has been observed that addition
of salt to an existing PEM leads to more loop formation of the polyelectrolytes at
the surface of the PEM, because of screening of the intermolecular repulsion in this
upper layer [22]. An increase in the distance between the charged groups of the
polyelectrolytes is observed, resulting in an increase in multilayer thickness at
higher ionic strength. The internal structure of PEMs can be altered by increased
external ionic strength. Due to the presence of additional charges at the upper layer
in terms of salt, both perpendicular interdiffusion (for the absorbing polymer) and
parallel interdiffusion (resulting in smoothing the surface) occurs at the multilayer
surface [44].
One way to study the dynamical response of polyelectrolyte complexes and to
obtain information about their relaxation time is to carry out rheological
Fig. 4 Stability diagram of polyelectrolyte complexes as a function of the ionic strength for
systems where (a) t % t exp and (b) t > t exp . On the horizontal axis is the composition of the
mixture given. On the vertical axis is the salt concentration (C salt ). The L region indicates a liquid
state, and the G region the glassy (quenched) state; S indicates soluble polyelectrolyte complexes.
In the N region, no complexation occurs [1]. (a) is a slight modification of the diagram proposed
by Kovacevic et al. [31]
Relaxation Phenomena During Polyelectrolyte Complex Formation
147
systems where t % t exp (Fig. 4a) and systems where t > t exp (Fig. 4b), as function
of the ionic strength. The main difference between these two stability diagrams is
the appearance of a liquid phase (L). Whether a liquid phase is found in a system
depends on the nature of the polyelectrolytes, i.e., weakly charged polyelectrolytes
tend to form liquid-like complex phases as above a certain (low) salt concentration.
In these systems, exponential growth is typically observed above a certain ionic
strength. Systems containing strongly charged polyelectrolytes, which typically
show linear PEM growth, form glass-like phases, although at very high salt
concentration these glass-like complexes may again become liquid-like. Examples
of both systems will be discussed in Sect. 2.1 on dynamic light scattering titration.
Small ions can help polyelectrolyte complexes to rearrange in the same manner
as protons do (see Fig. 3) [43]. Increasing the ionic strength makes the breaking of
an ion pair cheaper in terms of energy. For PEMs it has been observed that addition
of salt to an existing PEM leads to more loop formation of the polyelectrolytes at
the surface of the PEM, because of screening of the intermolecular repulsion in this
upper layer [22]. An increase in the distance between the charged groups of the
polyelectrolytes is observed, resulting in an increase in multilayer thickness at
higher ionic strength. The internal structure of PEMs can be altered by increased
external ionic strength. Due to the presence of additional charges at the upper layer
in terms of salt, both perpendicular interdiffusion (for the absorbing polymer) and
parallel interdiffusion (resulting in smoothing the surface) occurs at the multilayer
surface [44].
One way to study the dynamical response of polyelectrolyte complexes and to
obtain information about their relaxation time is to carry out rheological
Fig. 4 Stability diagram of polyelectrolyte complexes as a function of the ionic strength for
systems where (a) t % t exp and (b) t > t exp . On the horizontal axis is the composition of the
mixture given. On the vertical axis is the salt concentration (C salt ). The L region indicates a liquid
state, and the G region the glassy (quenched) state; S indicates soluble polyelectrolyte complexes.
In the N region, no complexation occurs [1]. (a) is a slight modification of the diagram proposed
by Kovacevic et al. [31]
Relaxation Phenomena During Polyelectrolyte Complex Formation
147