

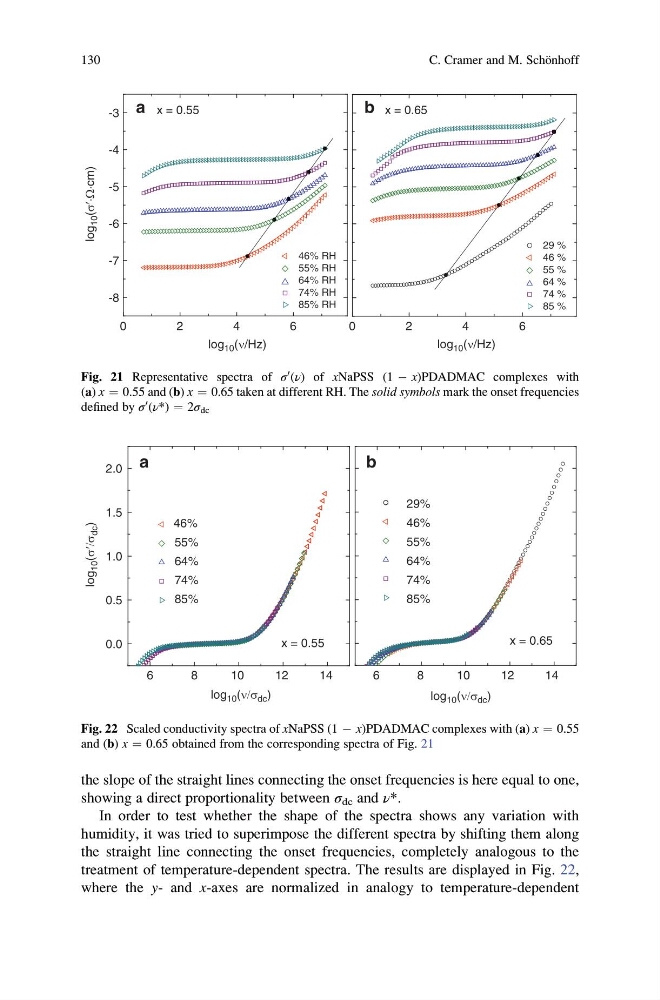
the slope of the straight lines connecting the onset frequencies is here equal to one,
showing a direct proportionality between σ dc and ν*.
In order to test whether the shape of the spectra shows any variation with
humidity, it was tried to superimpose the different spectra by shifting them along
the straight line connecting the onset frequencies, completely analogous to the
treatment of temperature-dependent spectra. The results are displayed in Fig. 22,
where the y- and x-axes are normalized in analogy to temperature-dependent
0
2
4
6
-8
-7
-6
-5
-4
-3 a x = 0.55
log
10 (σ′
×Ω×cm)
log 10 (ν/Hz)
log 10 (ν/Hz)
46% RH
55% RH
64% RH
74% RH
85% RH
0
2
4
6
b x = 0.65
29 %
46 %
55 %
64 %
74 %
85 %
Fig. 21 Representative spectra of σ
0 (ν) of xNaPSS (1 À x)PDADMAC complexes with
(a) x ¼ 0.55 and (b) x ¼ 0.65 taken at different RH. The solid symbols mark the onset frequencies
defined by σ
0 (ν*) ¼ 2σ dc
6
8
10
12
14
x = 0.65
b
log 10 (ν/σ dc )
29%
46%
55%
64%
74%
85%
6
8
10
12
14
0.0
0.5
1.0
1.5
2.0
x = 0.55
a
log 10 (ν/σ dc )
log
10 (σ′/σ
dc )
46%
55%
64%
74%
85%
Fig. 22 Scaled conductivity spectra of xNaPSS (1 À x)PDADMAC complexes with (a) x ¼ 0.55
and (b) x ¼ 0.65 obtained from the corresponding spectra of Fig. 21
130
C. Cramer and M. Scho ¨nhoff
showing a direct proportionality between σ dc and ν*.
In order to test whether the shape of the spectra shows any variation with
humidity, it was tried to superimpose the different spectra by shifting them along
the straight line connecting the onset frequencies, completely analogous to the
treatment of temperature-dependent spectra. The results are displayed in Fig. 22,
where the y- and x-axes are normalized in analogy to temperature-dependent
0
2
4
6
-8
-7
-6
-5
-4
-3 a x = 0.55
log
10 (σ′
×Ω×cm)
log 10 (ν/Hz)
log 10 (ν/Hz)
46% RH
55% RH
64% RH
74% RH
85% RH
0
2
4
6
b x = 0.65
29 %
46 %
55 %
64 %
74 %
85 %
Fig. 21 Representative spectra of σ
0 (ν) of xNaPSS (1 À x)PDADMAC complexes with
(a) x ¼ 0.55 and (b) x ¼ 0.65 taken at different RH. The solid symbols mark the onset frequencies
defined by σ
0 (ν*) ¼ 2σ dc
6
8
10
12
14
x = 0.65
b
log 10 (ν/σ dc )
29%
46%
55%
64%
74%
85%
6
8
10
12
14
0.0
0.5
1.0
1.5
2.0
x = 0.55
a
log 10 (ν/σ dc )
log
10 (σ′/σ
dc )
46%
55%
64%
74%
85%
Fig. 22 Scaled conductivity spectra of xNaPSS (1 À x)PDADMAC complexes with (a) x ¼ 0.55
and (b) x ¼ 0.65 obtained from the corresponding spectra of Fig. 21
130
C. Cramer and M. Scho ¨nhoff