

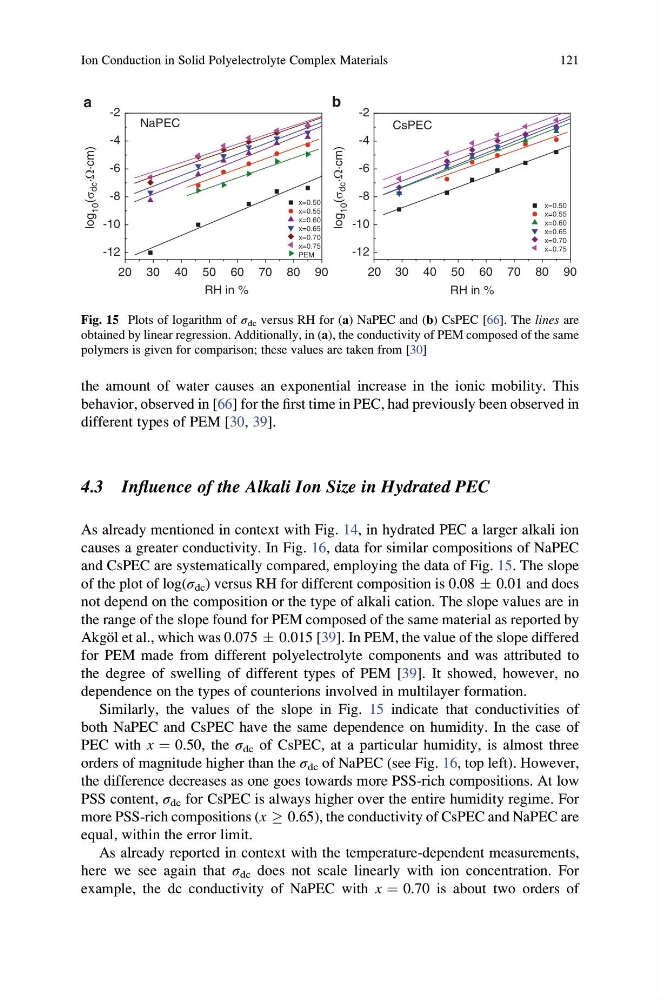
the amount of water causes an exponential increase in the ionic mobility. This
behavior, observed in [66] for the first time in PEC, had previously been observed in
different types of PEM [30, 39].
4.3 Influence of the Alkali Ion Size in Hydrated PEC
As already mentioned in context with Fig. 14, in hydrated PEC a larger alkali ion
causes a greater conductivity. In Fig. 16, data for similar compositions of NaPEC
and CsPEC are systematically compared, employing the data of Fig. 15. The slope
of the plot of log(σ dc ) versus RH for different composition is 0.08 Æ 0.01 and does
not depend on the composition or the type of alkali cation. The slope values are in
the range of the slope found for PEM composed of the same material as reported by
Akgo ¨l et al., which was 0.075 Æ 0.015 [39]. In PEM, the value of the slope differed
for PEM made from different polyelectrolyte components and was attributed to
the degree of swelling of different types of PEM [39]. It showed, however, no
dependence on the types of counterions involved in multilayer formation.
Similarly, the values of the slope in Fig. 15 indicate that conductivities of
both NaPEC and CsPEC have the same dependence on humidity. In the case of
PEC with x ¼ 0.50, the σ dc of CsPEC, at a particular humidity, is almost three
orders of magnitude higher than the σ dc of NaPEC (see Fig. 16, top left). However,
the difference decreases as one goes towards more PSS-rich compositions. At low
PSS content, σ dc for CsPEC is always higher over the entire humidity regime. For
more PSS-rich compositions (x ! 0.65), the conductivity of CsPEC and NaPEC are
equal, within the error limit.
As already reported in context with the temperature-dependent measurements,
here we see again that σ dc does not scale linearly with ion concentration. For
example, the dc conductivity of NaPEC with x ¼ 0.70 is about two orders of
20 30 40 50 60 70 80 90
-12
-10
-8
-6
-4
-2
RH in %
x=0.50
x=0.55
x=0.60
x=0.65
x=0.70
x=0.75
CsPEC
20 30 40 50 60 70 80 90
-12
-10
-8
-6
-4
-2
RH in %
x=0.50
x=0.55
x=0.60
x=0.65
x=0.70
x=0.75
PEM
NaPEC
log
10
(s
dc ·W·cm)
log
10
(s
dc ·W·cm)
a
b
Fig. 15 Plots of logarithm of σ dc versus RH for (a) NaPEC and (b) CsPEC [66]. The lines are
obtained by linear regression. Additionally, in (a), the conductivity of PEM composed of the same
polymers is given for comparison; these values are taken from [30]
Ion Conduction in Solid Polyelectrolyte Complex Materials
121
behavior, observed in [66] for the first time in PEC, had previously been observed in
different types of PEM [30, 39].
4.3 Influence of the Alkali Ion Size in Hydrated PEC
As already mentioned in context with Fig. 14, in hydrated PEC a larger alkali ion
causes a greater conductivity. In Fig. 16, data for similar compositions of NaPEC
and CsPEC are systematically compared, employing the data of Fig. 15. The slope
of the plot of log(σ dc ) versus RH for different composition is 0.08 Æ 0.01 and does
not depend on the composition or the type of alkali cation. The slope values are in
the range of the slope found for PEM composed of the same material as reported by
Akgo ¨l et al., which was 0.075 Æ 0.015 [39]. In PEM, the value of the slope differed
for PEM made from different polyelectrolyte components and was attributed to
the degree of swelling of different types of PEM [39]. It showed, however, no
dependence on the types of counterions involved in multilayer formation.
Similarly, the values of the slope in Fig. 15 indicate that conductivities of
both NaPEC and CsPEC have the same dependence on humidity. In the case of
PEC with x ¼ 0.50, the σ dc of CsPEC, at a particular humidity, is almost three
orders of magnitude higher than the σ dc of NaPEC (see Fig. 16, top left). However,
the difference decreases as one goes towards more PSS-rich compositions. At low
PSS content, σ dc for CsPEC is always higher over the entire humidity regime. For
more PSS-rich compositions (x ! 0.65), the conductivity of CsPEC and NaPEC are
equal, within the error limit.
As already reported in context with the temperature-dependent measurements,
here we see again that σ dc does not scale linearly with ion concentration. For
example, the dc conductivity of NaPEC with x ¼ 0.70 is about two orders of
20 30 40 50 60 70 80 90
-12
-10
-8
-6
-4
-2
RH in %
x=0.50
x=0.55
x=0.60
x=0.65
x=0.70
x=0.75
CsPEC
20 30 40 50 60 70 80 90
-12
-10
-8
-6
-4
-2
RH in %
x=0.50
x=0.55
x=0.60
x=0.65
x=0.70
x=0.75
PEM
NaPEC
log
10
(s
dc ·W·cm)
log
10
(s
dc ·W·cm)
a
b
Fig. 15 Plots of logarithm of σ dc versus RH for (a) NaPEC and (b) CsPEC [66]. The lines are
obtained by linear regression. Additionally, in (a), the conductivity of PEM composed of the same
polymers is given for comparison; these values are taken from [30]
Ion Conduction in Solid Polyelectrolyte Complex Materials
121