

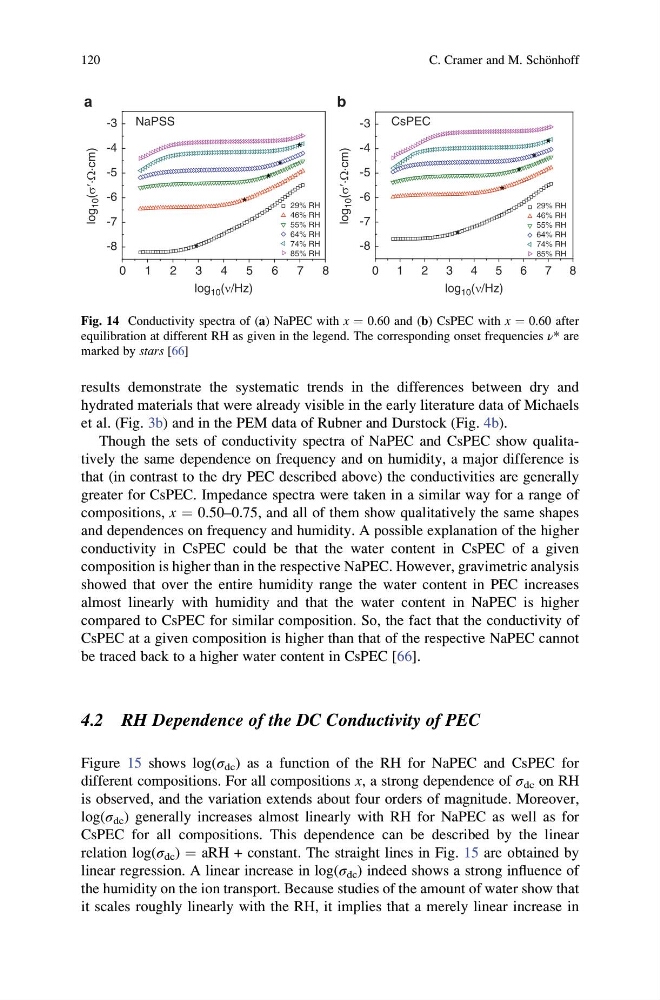
results demonstrate the systematic trends in the differences between dry and
hydrated materials that were already visible in the early literature data of Michaels
et al. (Fig. 3b) and in the PEM data of Rubner and Durstock (Fig. 4b).
Though the sets of conductivity spectra of NaPEC and CsPEC show qualitatively the same dependence on frequency and on humidity, a major difference is
that (in contrast to the dry PEC described above) the conductivities are generally
greater for CsPEC. Impedance spectra were taken in a similar way for a range of
compositions, x ¼ 0.50–0.75, and all of them show qualitatively the same shapes
and dependences on frequency and humidity. A possible explanation of the higher
conductivity in CsPEC could be that the water content in CsPEC of a given
composition is higher than in the respective NaPEC. However, gravimetric analysis
showed that over the entire humidity range the water content in PEC increases
almost linearly with humidity and that the water content in NaPEC is higher
compared to CsPEC for similar composition. So, the fact that the conductivity of
CsPEC at a given composition is higher than that of the respective NaPEC cannot
be traced back to a higher water content in CsPEC [66].
4.2 RH Dependence of the DC Conductivity of PEC
Figure 15 shows log(σ dc ) as a function of the RH for NaPEC and CsPEC for
different compositions. For all compositions x, a strong dependence of σ dc on RH
is observed, and the variation extends about four orders of magnitude. Moreover,
log(σ dc ) generally increases almost linearly with RH for NaPEC as well as for
CsPEC for all compositions. This dependence can be described by the linear
relation log(σ dc ) ¼ aRH + constant. The straight lines in Fig. 15 are obtained by
linear regression. A linear increase in log(σ dc ) indeed shows a strong influence of
the humidity on the ion transport. Because studies of the amount of water show that
it scales roughly linearly with the RH, it implies that a merely linear increase in
0
1
2
3
4
5
6
7
8
-8
-7
-6
-5
-4
-3
29% RH
46% RH
55% RH
64% RH
74% RH
85% RH
log 10 (ν/Hz)
log 10 (ν/Hz)
NaPSS
0
1
2
3
4
5
6
7
8
-8
-7
-6
-5
-4
-3
29% RH
46% RH
55% RH
64% RH
74% RH
85% RH
CsPEC
log
10 (s′·W·cm)
log
10 (s′·W·cm)
a
b
Fig. 14 Conductivity spectra of (a) NaPEC with x ¼ 0.60 and (b) CsPEC with x ¼ 0.60 after
equilibration at different RH as given in the legend. The corresponding onset frequencies ν* are
marked by stars [66]
120
C. Cramer and M. Scho ¨nhoff
hydrated materials that were already visible in the early literature data of Michaels
et al. (Fig. 3b) and in the PEM data of Rubner and Durstock (Fig. 4b).
Though the sets of conductivity spectra of NaPEC and CsPEC show qualitatively the same dependence on frequency and on humidity, a major difference is
that (in contrast to the dry PEC described above) the conductivities are generally
greater for CsPEC. Impedance spectra were taken in a similar way for a range of
compositions, x ¼ 0.50–0.75, and all of them show qualitatively the same shapes
and dependences on frequency and humidity. A possible explanation of the higher
conductivity in CsPEC could be that the water content in CsPEC of a given
composition is higher than in the respective NaPEC. However, gravimetric analysis
showed that over the entire humidity range the water content in PEC increases
almost linearly with humidity and that the water content in NaPEC is higher
compared to CsPEC for similar composition. So, the fact that the conductivity of
CsPEC at a given composition is higher than that of the respective NaPEC cannot
be traced back to a higher water content in CsPEC [66].
4.2 RH Dependence of the DC Conductivity of PEC
Figure 15 shows log(σ dc ) as a function of the RH for NaPEC and CsPEC for
different compositions. For all compositions x, a strong dependence of σ dc on RH
is observed, and the variation extends about four orders of magnitude. Moreover,
log(σ dc ) generally increases almost linearly with RH for NaPEC as well as for
CsPEC for all compositions. This dependence can be described by the linear
relation log(σ dc ) ¼ aRH + constant. The straight lines in Fig. 15 are obtained by
linear regression. A linear increase in log(σ dc ) indeed shows a strong influence of
the humidity on the ion transport. Because studies of the amount of water show that
it scales roughly linearly with the RH, it implies that a merely linear increase in
0
1
2
3
4
5
6
7
8
-8
-7
-6
-5
-4
-3
29% RH
46% RH
55% RH
64% RH
74% RH
85% RH
log 10 (ν/Hz)
log 10 (ν/Hz)
NaPSS
0
1
2
3
4
5
6
7
8
-8
-7
-6
-5
-4
-3
29% RH
46% RH
55% RH
64% RH
74% RH
85% RH
CsPEC
log
10 (s′·W·cm)
log
10 (s′·W·cm)
a
b
Fig. 14 Conductivity spectra of (a) NaPEC with x ¼ 0.60 and (b) CsPEC with x ¼ 0.60 after
equilibration at different RH as given in the legend. The corresponding onset frequencies ν* are
marked by stars [66]
120
C. Cramer and M. Scho ¨nhoff