

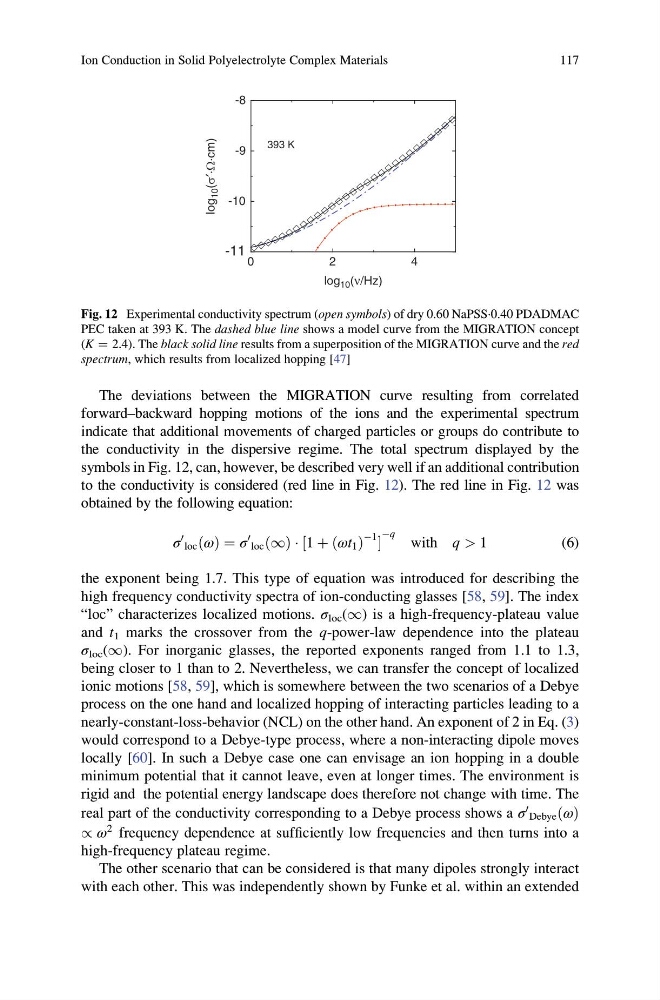
The deviations between the MIGRATION curve resulting from correlated
forward–backward hopping motions of the ions and the experimental spectrum
indicate that additional movements of charged particles or groups do contribute to
the conductivity in the dispersive regime. The total spectrum displayed by the
symbols in Fig. 12, can, however, be described very well if an additional contribution
to the conductivity is considered (red line in Fig. 12). The red line in Fig. 12 was
obtained by the following equation:
σ
0
loc ðωÞ ¼ σ
0
loc ð1Þ Á ½1 þ ðωt 1 Þ
À1
Àq
with q > 1
(6)
the exponent being 1.7. This type of equation was introduced for describing the
high frequency conductivity spectra of ion-conducting glasses [58, 59]. The index
“loc” characterizes localized motions. σ loc (1) is a high-frequency-plateau value
and t 1 marks the crossover from the q-power-law dependence into the plateau
σ loc (1). For inorganic glasses, the reported exponents ranged from 1.1 to 1.3,
being closer to 1 than to 2. Nevertheless, we can transfer the concept of localized
ionic motions [58, 59], which is somewhere between the two scenarios of a Debye
process on the one hand and localized hopping of interacting particles leading to a
nearly-constant-loss-behavior (NCL) on the other hand. An exponent of 2 in Eq. (3)
would correspond to a Debye-type process, where a non-interacting dipole moves
locally [60]. In such a Debye case one can envisage an ion hopping in a double
minimum potential that it cannot leave, even at longer times. The environment is
rigid and the potential energy landscape does therefore not change with time. The
real part of the conductivity corresponding to a Debye process shows a σ
0
Debye ðωÞ
/ ω
2 frequency dependence at sufficiently low frequencies and then turns into a
high-frequency plateau regime.
The other scenario that can be considered is that many dipoles strongly interact
with each other. This was independently shown by Funke et al. within an extended
0
2
4
-11
-10
-9
-8
log 10 (ν/Hz)
393 K
log
10 (s′·W·cm)
Fig. 12 Experimental conductivity spectrum (open symbols) of dry 0.60 NaPSS·0.40 PDADMAC
PEC taken at 393 K. The dashed blue line shows a model curve from the MIGRATION concept
(K ¼ 2.4). The black solid line results from a superposition of the MIGRATION curve and the red
spectrum, which results from localized hopping [47]
Ion Conduction in Solid Polyelectrolyte Complex Materials
117
forward–backward hopping motions of the ions and the experimental spectrum
indicate that additional movements of charged particles or groups do contribute to
the conductivity in the dispersive regime. The total spectrum displayed by the
symbols in Fig. 12, can, however, be described very well if an additional contribution
to the conductivity is considered (red line in Fig. 12). The red line in Fig. 12 was
obtained by the following equation:
σ
0
loc ðωÞ ¼ σ
0
loc ð1Þ Á ½1 þ ðωt 1 Þ
À1
Àq
with q > 1
(6)
the exponent being 1.7. This type of equation was introduced for describing the
high frequency conductivity spectra of ion-conducting glasses [58, 59]. The index
“loc” characterizes localized motions. σ loc (1) is a high-frequency-plateau value
and t 1 marks the crossover from the q-power-law dependence into the plateau
σ loc (1). For inorganic glasses, the reported exponents ranged from 1.1 to 1.3,
being closer to 1 than to 2. Nevertheless, we can transfer the concept of localized
ionic motions [58, 59], which is somewhere between the two scenarios of a Debye
process on the one hand and localized hopping of interacting particles leading to a
nearly-constant-loss-behavior (NCL) on the other hand. An exponent of 2 in Eq. (3)
would correspond to a Debye-type process, where a non-interacting dipole moves
locally [60]. In such a Debye case one can envisage an ion hopping in a double
minimum potential that it cannot leave, even at longer times. The environment is
rigid and the potential energy landscape does therefore not change with time. The
real part of the conductivity corresponding to a Debye process shows a σ
0
Debye ðωÞ
/ ω
2 frequency dependence at sufficiently low frequencies and then turns into a
high-frequency plateau regime.
The other scenario that can be considered is that many dipoles strongly interact
with each other. This was independently shown by Funke et al. within an extended
0
2
4
-11
-10
-9
-8
log 10 (ν/Hz)
393 K
log
10 (s′·W·cm)
Fig. 12 Experimental conductivity spectrum (open symbols) of dry 0.60 NaPSS·0.40 PDADMAC
PEC taken at 393 K. The dashed blue line shows a model curve from the MIGRATION concept
(K ¼ 2.4). The black solid line results from a superposition of the MIGRATION curve and the red
spectrum, which results from localized hopping [47]
Ion Conduction in Solid Polyelectrolyte Complex Materials
117