

in contrast to analogous PEC materials in which LiPSS or CsPSS are used instead of
NaPSS [48]. This will be discussed in more detail in Sect. 3.3.
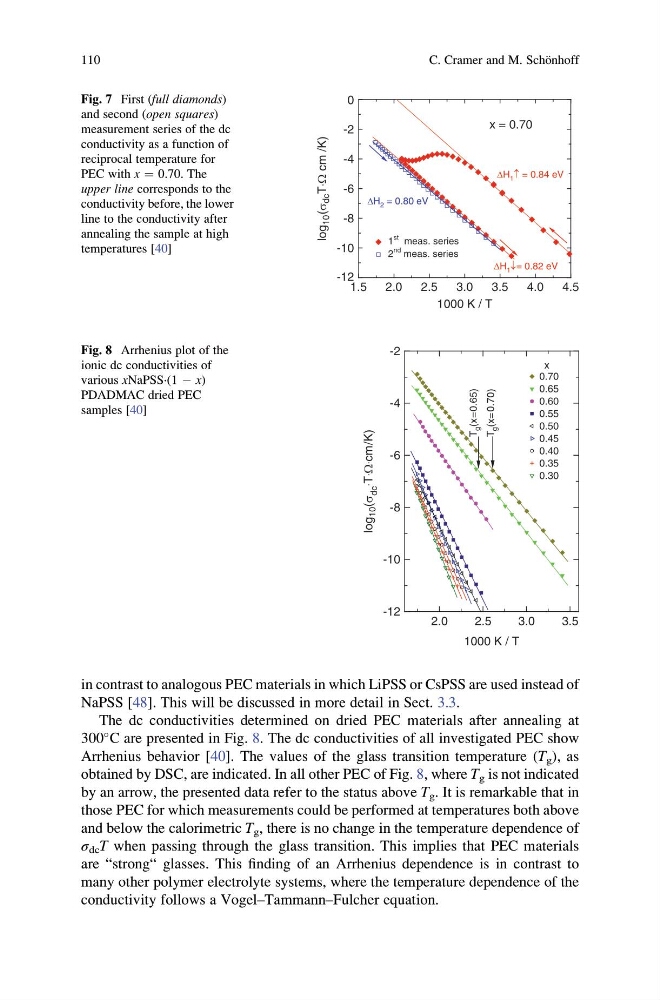
The dc conductivities determined on dried PEC materials after annealing at
300
C are presented in Fig. 8. The dc conductivities of all investigated PEC show
Arrhenius behavior [40]. The values of the glass transition temperature (T g ), as
obtained by DSC, are indicated. In all other PEC of Fig. 8, where T g is not indicated
by an arrow, the presented data refer to the status above T g . It is remarkable that in
those PEC for which measurements could be performed at temperatures both above
and below the calorimetric T g , there is no change in the temperature dependence of
σ dc T when passing through the glass transition. This implies that PEC materials
are “strong“ glasses. This finding of an Arrhenius dependence is in contrast to
many other polymer electrolyte systems, where the temperature dependence of the
conductivity follows a Vogel–Tammann–Fulcher equation.
1.5
2.0
2.5
3.0
3.5
4.0
4.5
-12
-10
-8
-6
-4
-2
0
ΔH 1 ↓= 0.82 eV
ΔH 1 ↑ = 0.84 eV
1
st meas. series
2
nd meas. series
log
10 (σ
dc T⋅Ω cm /K)
1000 K / T
x = 0.70
ΔH 2 = 0.80 eV
Fig. 7 First (full diamonds)
and second (open squares)
measurement series of the dc
conductivity as a function of
reciprocal temperature for
PEC with x ¼ 0.70. The
upper line corresponds to the
conductivity before, the lower
line to the conductivity after
annealing the sample at high
temperatures [40]
2.0
2.5
3.0
3.5
-12
-10
-8
-6
-4
-2
T
g (x=0.65)
0.70
0.65
0.60
0.55
0.50
0.45
0.40
0.35
0.30
log
10 (σ
dc
.
T .
Ω .
cm/K)
1000 K / T
x
T
g (x=0.70)
Fig. 8 Arrhenius plot of the
ionic dc conductivities of
various xNaPSS·(1 À x)
PDADMAC dried PEC
samples [40]
110
C. Cramer and M. Scho ¨nhoff
NaPSS [48]. This will be discussed in more detail in Sect. 3.3.
The dc conductivities determined on dried PEC materials after annealing at
300
C are presented in Fig. 8. The dc conductivities of all investigated PEC show
Arrhenius behavior [40]. The values of the glass transition temperature (T g ), as
obtained by DSC, are indicated. In all other PEC of Fig. 8, where T g is not indicated
by an arrow, the presented data refer to the status above T g . It is remarkable that in
those PEC for which measurements could be performed at temperatures both above
and below the calorimetric T g , there is no change in the temperature dependence of
σ dc T when passing through the glass transition. This implies that PEC materials
are “strong“ glasses. This finding of an Arrhenius dependence is in contrast to
many other polymer electrolyte systems, where the temperature dependence of the
conductivity follows a Vogel–Tammann–Fulcher equation.
1.5
2.0
2.5
3.0
3.5
4.0
4.5
-12
-10
-8
-6
-4
-2
0
ΔH 1 ↓= 0.82 eV
ΔH 1 ↑ = 0.84 eV
1
st meas. series
2
nd meas. series
log
10 (σ
dc T⋅Ω cm /K)
1000 K / T
x = 0.70
ΔH 2 = 0.80 eV
Fig. 7 First (full diamonds)
and second (open squares)
measurement series of the dc
conductivity as a function of
reciprocal temperature for
PEC with x ¼ 0.70. The
upper line corresponds to the
conductivity before, the lower
line to the conductivity after
annealing the sample at high
temperatures [40]
2.0
2.5
3.0
3.5
-12
-10
-8
-6
-4
-2
T
g (x=0.65)
0.70
0.65
0.60
0.55
0.50
0.45
0.40
0.35
0.30
log
10 (σ
dc
.
T .
Ω .
cm/K)
1000 K / T
x
T
g (x=0.70)
Fig. 8 Arrhenius plot of the
ionic dc conductivities of
various xNaPSS·(1 À x)
PDADMAC dried PEC
samples [40]
110
C. Cramer and M. Scho ¨nhoff