

with their charges and velocities denoted by q i and v i , respectively. V is the volume
of the sample. Both i(t) and its autocorrelation function are functions of time t. In
the case that there is only one type of mobile charge carrier and if cross-correlations
between movements of different ions i and j can be neglected (single particle
approximation), the complex conductivity is simply expressed by the velocity
autocorrelation function vð0Þ Á vðtÞ
h
i :
^
σðωÞ ¼
Nq
2
3Vk B T
Á
ð 1
0
vð0Þ Á vðtÞ
h
iÁ expðÀiωtÞdt:
(3)
The complex conductivity ^
σðωÞ consists of a real part, denoted as σ
0
ðωÞ and an
imaginary part denoted as σ
00
ðωÞ:
^
σðωÞ ¼ σ
0
ðωÞ þ iσ
00
ðωÞ:
(4)
Similar to many complex physical quantities, the real and the imaginary part of
the complex conductivity are interconnected via Kramers–Kronig-relations. This
implies that σ
0
ðωÞ and σ
00
ðωÞ contain the same information and can be transformed
into each other, provided that the complete experimental spectrum is known. In the
work described in this review, both the real and the imaginary part of the complex
conductivity were experimentally determined, but the discussion will focus on the
real part of the conductivity. The dc conductivity is defined as the conductivity of
the ion conducting material, which one would measure in the limit ω ! 0 under
conditions where the interface to the electrodes does not block ion transport (“nonblocking” electrodes).
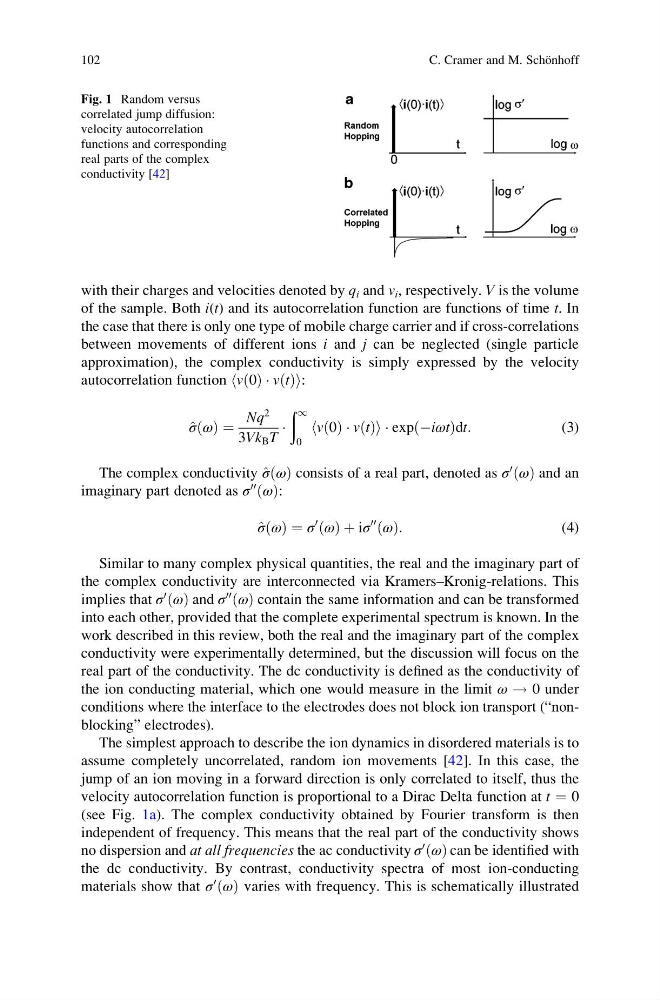
The simplest approach to describe the ion dynamics in disordered materials is to
assume completely uncorrelated, random ion movements [42]. In this case, the
jump of an ion moving in a forward direction is only correlated to itself, thus the
velocity autocorrelation function is proportional to a Dirac Delta function at t ¼ 0
(see Fig. 1a). The complex conductivity obtained by Fourier transform is then
independent of frequency. This means that the real part of the conductivity shows
no dispersion and at all frequencies the ac conductivity σ
0
ðωÞ can be identified with
the dc conductivity. By contrast, conductivity spectra of most ion-conducting
materials show that σ
0
ðωÞ varies with frequency. This is schematically illustrated
Fig. 1 Random versus
correlated jump diffusion:
velocity autocorrelation
functions and corresponding
real parts of the complex
conductivity [42]
102
C. Cramer and M. Scho ¨nhoff
of the sample. Both i(t) and its autocorrelation function are functions of time t. In
the case that there is only one type of mobile charge carrier and if cross-correlations
between movements of different ions i and j can be neglected (single particle
approximation), the complex conductivity is simply expressed by the velocity
autocorrelation function vð0Þ Á vðtÞ
h
i :
^
σðωÞ ¼
Nq
2
3Vk B T
Á
ð 1
0
vð0Þ Á vðtÞ
h
iÁ expðÀiωtÞdt:
(3)
The complex conductivity ^
σðωÞ consists of a real part, denoted as σ
0
ðωÞ and an
imaginary part denoted as σ
00
ðωÞ:
^
σðωÞ ¼ σ
0
ðωÞ þ iσ
00
ðωÞ:
(4)
Similar to many complex physical quantities, the real and the imaginary part of
the complex conductivity are interconnected via Kramers–Kronig-relations. This
implies that σ
0
ðωÞ and σ
00
ðωÞ contain the same information and can be transformed
into each other, provided that the complete experimental spectrum is known. In the
work described in this review, both the real and the imaginary part of the complex
conductivity were experimentally determined, but the discussion will focus on the
real part of the conductivity. The dc conductivity is defined as the conductivity of
the ion conducting material, which one would measure in the limit ω ! 0 under
conditions where the interface to the electrodes does not block ion transport (“nonblocking” electrodes).
The simplest approach to describe the ion dynamics in disordered materials is to
assume completely uncorrelated, random ion movements [42]. In this case, the
jump of an ion moving in a forward direction is only correlated to itself, thus the
velocity autocorrelation function is proportional to a Dirac Delta function at t ¼ 0
(see Fig. 1a). The complex conductivity obtained by Fourier transform is then
independent of frequency. This means that the real part of the conductivity shows
no dispersion and at all frequencies the ac conductivity σ
0
ðωÞ can be identified with
the dc conductivity. By contrast, conductivity spectra of most ion-conducting
materials show that σ
0
ðωÞ varies with frequency. This is schematically illustrated
Fig. 1 Random versus
correlated jump diffusion:
velocity autocorrelation
functions and corresponding
real parts of the complex
conductivity [42]
102
C. Cramer and M. Scho ¨nhoff