

Absorption spectroscopy is a good tool for determination of the degree of intraand interchain order within P3HT thin films. A detailed and quantitative analysis of
the absorption spectrum of regioregular P3HT was proposed by Spano and
coworkers [6, 77, 78]. For a thin P3HT film, two parts of the absorption spectrum
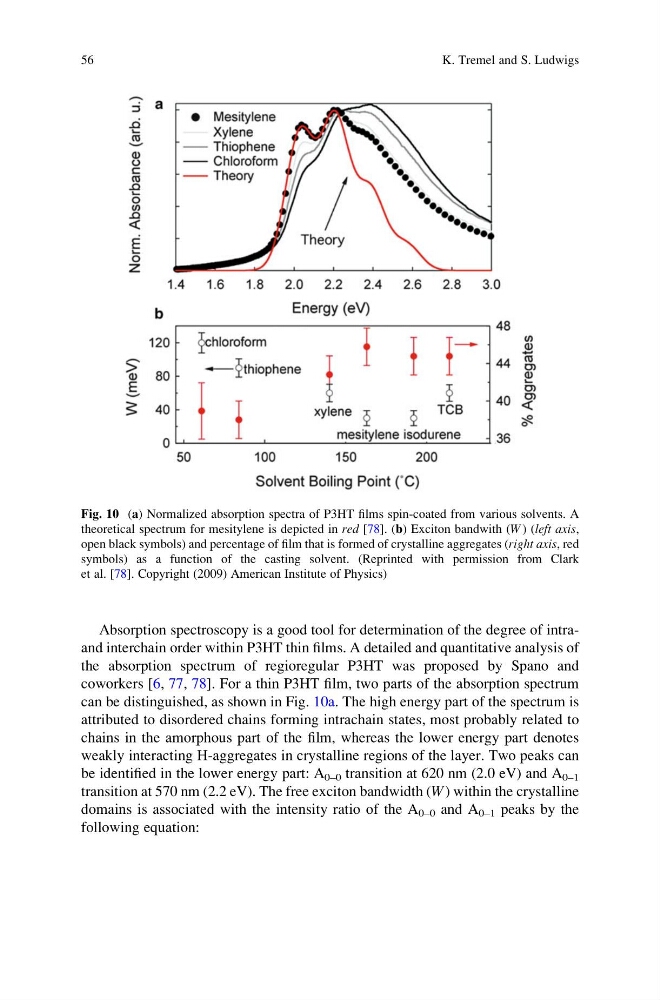
can be distinguished, as shown in Fig. 10a. The high energy part of the spectrum is
attributed to disordered chains forming intrachain states, most probably related to
chains in the amorphous part of the film, whereas the lower energy part denotes
weakly interacting H-aggregates in crystalline regions of the layer. Two peaks can
be identified in the lower energy part: A 0–0 transition at 620 nm (2.0 eV) and A 0–1
transition at 570 nm (2.2 eV). The free exciton bandwidth (W ) within the crystalline
domains is associated with the intensity ratio of the A 0–0 and A 0–1 peaks by the
following equation:
Fig. 10 (a) Normalized absorption spectra of P3HT films spin-coated from various solvents. A
theoretical spectrum for mesitylene is depicted in red [78]. (b) Exciton bandwith (W ) (left axis,
open black symbols) and percentage of film that is formed of crystalline aggregates (right axis, red
symbols) as a function of the casting solvent. (Reprinted with permission from Clark
et al. [78]. Copyright (2009) American Institute of Physics)
56
K. Tremel and S. Ludwigs
the absorption spectrum of regioregular P3HT was proposed by Spano and
coworkers [6, 77, 78]. For a thin P3HT film, two parts of the absorption spectrum
can be distinguished, as shown in Fig. 10a. The high energy part of the spectrum is
attributed to disordered chains forming intrachain states, most probably related to
chains in the amorphous part of the film, whereas the lower energy part denotes
weakly interacting H-aggregates in crystalline regions of the layer. Two peaks can
be identified in the lower energy part: A 0–0 transition at 620 nm (2.0 eV) and A 0–1
transition at 570 nm (2.2 eV). The free exciton bandwidth (W ) within the crystalline
domains is associated with the intensity ratio of the A 0–0 and A 0–1 peaks by the
following equation:
Fig. 10 (a) Normalized absorption spectra of P3HT films spin-coated from various solvents. A
theoretical spectrum for mesitylene is depicted in red [78]. (b) Exciton bandwith (W ) (left axis,
open black symbols) and percentage of film that is formed of crystalline aggregates (right axis, red
symbols) as a function of the casting solvent. (Reprinted with permission from Clark
et al. [78]. Copyright (2009) American Institute of Physics)
56
K. Tremel and S. Ludwigs