

electron beam is passed through the thin sample to obtain the TEM image due to
diffraction or mass-thickness contrast.
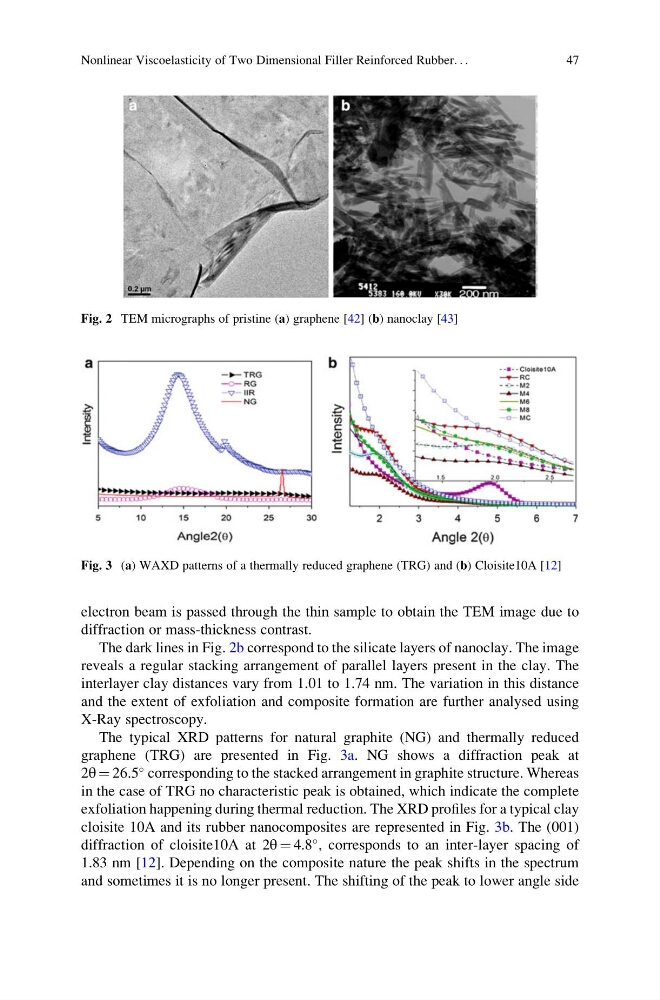
The dark lines in Fig. 2b correspond to the silicate layers of nanoclay. The image
reveals a regular stacking arrangement of parallel layers present in the clay. The
interlayer clay distances vary from 1.01 to 1.74 nm. The variation in this distance
and the extent of exfoliation and composite formation are further analysed using
X-Ray spectroscopy.
The typical XRD patterns for natural graphite (NG) and thermally reduced
graphene (TRG) are presented in Fig. 3a. NG shows a diffraction peak at
2θ ¼ 26.5
corresponding to the stacked arrangement in graphite structure. Whereas
in the case of TRG no characteristic peak is obtained, which indicate the complete
exfoliation happening during thermal reduction. The XRD profiles for a typical clay
cloisite 10A and its rubber nanocomposites are represented in Fig. 3b. The (001)
diffraction of cloisite10A at 2θ ¼ 4.8
, corresponds to an inter-layer spacing of
1.83 nm [12]. Depending on the composite nature the peak shifts in the spectrum
and sometimes it is no longer present. The shifting of the peak to lower angle side
Fig. 2 TEM micrographs of pristine (a) graphene [42] (b) nanoclay [43]
Fig. 3 (a) WAXD patterns of a thermally reduced graphene (TRG) and (b) Cloisite10A [12]
Nonlinear Viscoelasticity of Two Dimensional Filler Reinforced Rubber. . .
47
diffraction or mass-thickness contrast.
The dark lines in Fig. 2b correspond to the silicate layers of nanoclay. The image
reveals a regular stacking arrangement of parallel layers present in the clay. The
interlayer clay distances vary from 1.01 to 1.74 nm. The variation in this distance
and the extent of exfoliation and composite formation are further analysed using
X-Ray spectroscopy.
The typical XRD patterns for natural graphite (NG) and thermally reduced
graphene (TRG) are presented in Fig. 3a. NG shows a diffraction peak at
2θ ¼ 26.5
corresponding to the stacked arrangement in graphite structure. Whereas
in the case of TRG no characteristic peak is obtained, which indicate the complete
exfoliation happening during thermal reduction. The XRD profiles for a typical clay
cloisite 10A and its rubber nanocomposites are represented in Fig. 3b. The (001)
diffraction of cloisite10A at 2θ ¼ 4.8
, corresponds to an inter-layer spacing of
1.83 nm [12]. Depending on the composite nature the peak shifts in the spectrum
and sometimes it is no longer present. The shifting of the peak to lower angle side
Fig. 2 TEM micrographs of pristine (a) graphene [42] (b) nanoclay [43]
Fig. 3 (a) WAXD patterns of a thermally reduced graphene (TRG) and (b) Cloisite10A [12]
Nonlinear Viscoelasticity of Two Dimensional Filler Reinforced Rubber. . .
47