

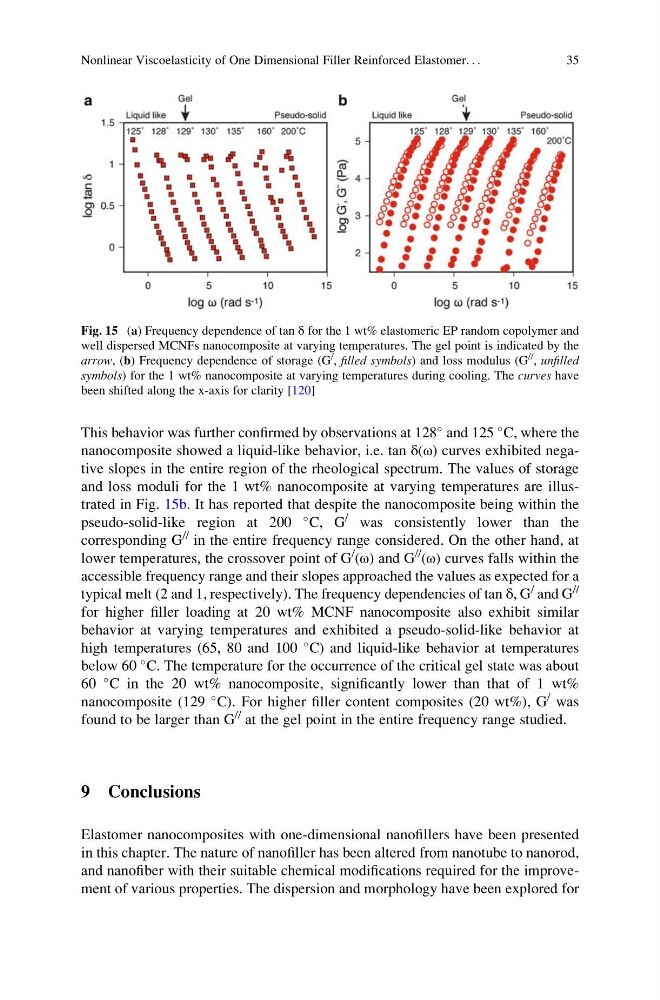
This behavior was further confirmed by observations at 128
and 125
C, where the
nanocomposite showed a liquid-like behavior, i.e. tan δ(ω) curves exhibited negative slopes in the entire region of the rheological spectrum. The values of storage
and loss moduli for the 1 wt% nanocomposite at varying temperatures are illustrated in Fig. 15b. It has reported that despite the nanocomposite being within the
pseudo-solid-like region at 200
C, G
/ was consistently lower than the
corresponding G
// in the entire frequency range considered. On the other hand, at
lower temperatures, the crossover point of G
/
(ω) and G
//
(ω) curves falls within the
accessible frequency range and their slopes approached the values as expected for a
typical melt (2 and 1, respectively). The frequency dependencies of tan δ, G
/ and G
//
for higher filler loading at 20 wt% MCNF nanocomposite also exhibit similar
behavior at varying temperatures and exhibited a pseudo-solid-like behavior at
high temperatures (65, 80 and 100
C) and liquid-like behavior at temperatures
below 60
C. The temperature for the occurrence of the critical gel state was about
60
C in the 20 wt% nanocomposite, significantly lower than that of 1 wt%
nanocomposite (129
C). For higher filler content composites (20 wt%), G
/ was
found to be larger than G
// at the gel point in the entire frequency range studied.
9 Conclusions
Elastomer nanocomposites with one-dimensional nanofillers have been presented
in this chapter. The nature of nanofiller has been altered from nanotube to nanorod,
and nanofiber with their suitable chemical modifications required for the improvement of various properties. The dispersion and morphology have been explored for
Fig. 15 (a) Frequency dependence of tan δ for the 1 wt% elastomeric EP random copolymer and
well dispersed MCNFs nanocomposite at varying temperatures. The gel point is indicated by the
arrow, (b) Frequency dependence of storage (G
/
, filled symbols) and loss modulus (G
// , unfilled
symbols) for the 1 wt% nanocomposite at varying temperatures during cooling. The curves have
been shifted along the x-axis for clarity [120]
Nonlinear Viscoelasticity of One Dimensional Filler Reinforced Elastomer. . .
35
and 125
C, where the
nanocomposite showed a liquid-like behavior, i.e. tan δ(ω) curves exhibited negative slopes in the entire region of the rheological spectrum. The values of storage
and loss moduli for the 1 wt% nanocomposite at varying temperatures are illustrated in Fig. 15b. It has reported that despite the nanocomposite being within the
pseudo-solid-like region at 200
C, G
/ was consistently lower than the
corresponding G
// in the entire frequency range considered. On the other hand, at
lower temperatures, the crossover point of G
/
(ω) and G
//
(ω) curves falls within the
accessible frequency range and their slopes approached the values as expected for a
typical melt (2 and 1, respectively). The frequency dependencies of tan δ, G
/ and G
//
for higher filler loading at 20 wt% MCNF nanocomposite also exhibit similar
behavior at varying temperatures and exhibited a pseudo-solid-like behavior at
high temperatures (65, 80 and 100
C) and liquid-like behavior at temperatures
below 60
C. The temperature for the occurrence of the critical gel state was about
60
C in the 20 wt% nanocomposite, significantly lower than that of 1 wt%
nanocomposite (129
C). For higher filler content composites (20 wt%), G
/ was
found to be larger than G
// at the gel point in the entire frequency range studied.
9 Conclusions
Elastomer nanocomposites with one-dimensional nanofillers have been presented
in this chapter. The nature of nanofiller has been altered from nanotube to nanorod,
and nanofiber with their suitable chemical modifications required for the improvement of various properties. The dispersion and morphology have been explored for
Fig. 15 (a) Frequency dependence of tan δ for the 1 wt% elastomeric EP random copolymer and
well dispersed MCNFs nanocomposite at varying temperatures. The gel point is indicated by the
arrow, (b) Frequency dependence of storage (G
/
, filled symbols) and loss modulus (G
// , unfilled
symbols) for the 1 wt% nanocomposite at varying temperatures during cooling. The curves have
been shifted along the x-axis for clarity [120]
Nonlinear Viscoelasticity of One Dimensional Filler Reinforced Elastomer. . .
35