

Evaluating Impacts of Traffic Incidents on CO 2 Emissions in Express Roads
39
The values of the constants K , a, b, c, d, e and f vary according to the vehicle
type under analysis and they are obtained from measurements performed considering
real cases [25]. Three vehicle types were considered for the coefficients of Eq. (1), as
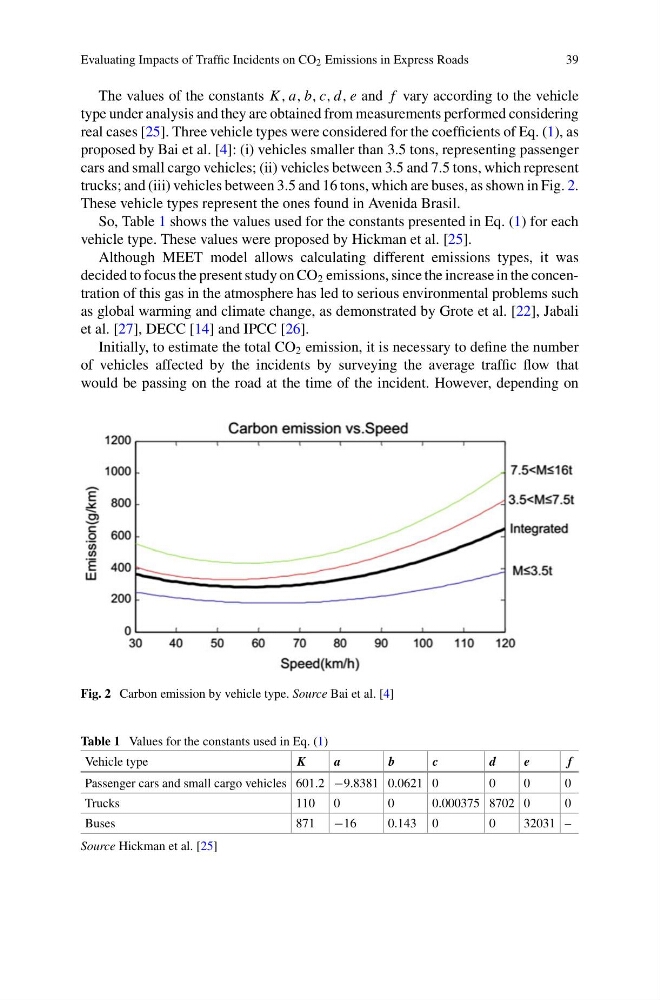
proposed by Bai et al. [4]: (i) vehicles smaller than 3.5 tons, representing passenger
cars and small cargo vehicles; (ii) vehicles between 3.5 and 7.5 tons, which represent
trucks; and (iii) vehicles between 3.5 and 16 tons, which are buses, as shown in Fig. 2.
These vehicle types represent the ones found in Avenida Brasil.
So, Table 1 shows the values used for the constants presented in Eq. (1) for each
vehicle type. These values were proposed by Hickman et al. [25].
Although MEET model allows calculating different emissions types, it was
decided to focus the present study on CO 2 emissions, since the increase in the concentration of this gas in the atmosphere has led to serious environmental problems such
as global warming and climate change, as demonstrated by Grote et al. [22], Jabali
et al. [27], DECC [14] and IPCC [26].
Initially, to estimate the total CO 2 emission, it is necessary to define the number
of vehicles affected by the incidents by surveying the average traffic flow that
would be passing on the road at the time of the incident. However, depending on
Fig. 2 Carbon emission by vehicle type. Source Bai et al. [4]
Table 1 Values for the constants used in Eq. (1)
Vehicle type
K
a
b
c
d
e
f
Passenger cars and small cargo vehicles 601.2 −9.8381 0.0621 0
0
0
0
Trucks
110 0
0
0.000375 8702 0
0
Buses
871 −16
0.143 0
0
32031 –
Source Hickman et al. [25]
39
The values of the constants K , a, b, c, d, e and f vary according to the vehicle
type under analysis and they are obtained from measurements performed considering
real cases [25]. Three vehicle types were considered for the coefficients of Eq. (1), as
proposed by Bai et al. [4]: (i) vehicles smaller than 3.5 tons, representing passenger
cars and small cargo vehicles; (ii) vehicles between 3.5 and 7.5 tons, which represent
trucks; and (iii) vehicles between 3.5 and 16 tons, which are buses, as shown in Fig. 2.
These vehicle types represent the ones found in Avenida Brasil.
So, Table 1 shows the values used for the constants presented in Eq. (1) for each
vehicle type. These values were proposed by Hickman et al. [25].
Although MEET model allows calculating different emissions types, it was
decided to focus the present study on CO 2 emissions, since the increase in the concentration of this gas in the atmosphere has led to serious environmental problems such
as global warming and climate change, as demonstrated by Grote et al. [22], Jabali
et al. [27], DECC [14] and IPCC [26].
Initially, to estimate the total CO 2 emission, it is necessary to define the number
of vehicles affected by the incidents by surveying the average traffic flow that
would be passing on the road at the time of the incident. However, depending on
Fig. 2 Carbon emission by vehicle type. Source Bai et al. [4]
Table 1 Values for the constants used in Eq. (1)
Vehicle type
K
a
b
c
d
e
f
Passenger cars and small cargo vehicles 601.2 −9.8381 0.0621 0
0
0
0
Trucks
110 0
0
0.000375 8702 0
0
Buses
871 −16
0.143 0
0
32031 –
Source Hickman et al. [25]