

Topography (Forward)
Curvature Correction of PECPEI-PAM/CS 1:12;ubernacht in H20;
stark belegt; Stelle3
Topography (Forward)
Curvature Correction of PECPEI-PAM/CS 1:12;Stelle 3: Stark beleght
Topography (Forward)
Curvature Correction of PECPEI-PAM/CS 1:12; Stelle2
Topography (Forward)
Curvature Correction of PECPEI-PAM/CS 1:12;
tiber nachit H20: Stelle 2
nm
nm nm
nm
3000
3000
2000
2000
1000
1000
0
90
80
70
60
50
40
30
20
10
0
100
0
0
4000
3000
3000
2000
2000
1000
1000
0
0
0
0
0
1000
1000
1000
2000
2000
2000
3000
3000
3000
0
1000
2000
3000
nm
nm
nm
nm
nm nm
nm
(A)
b
c
(B)
(C)
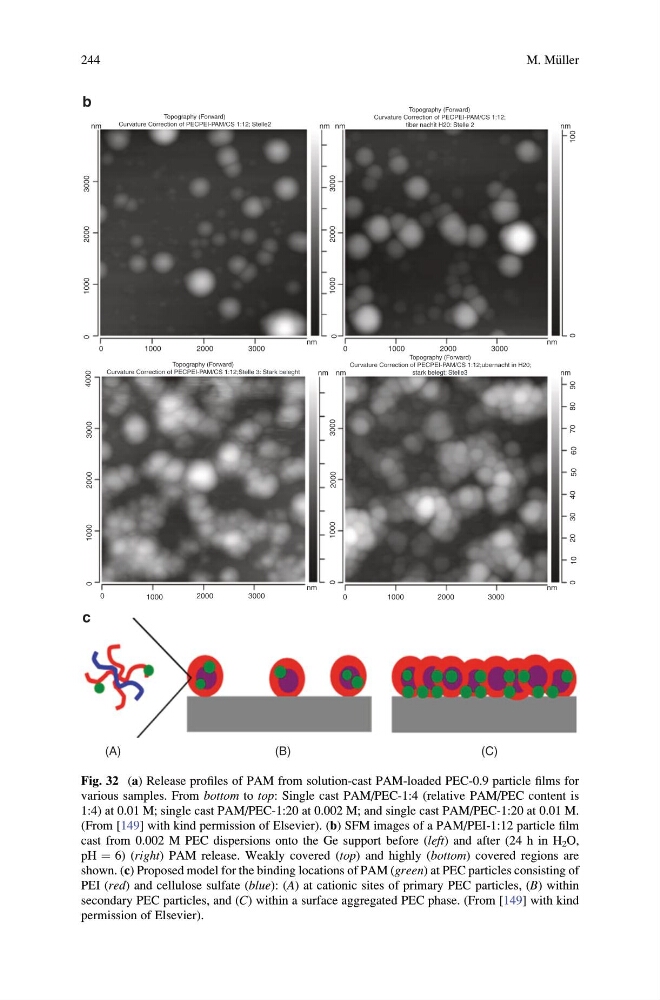
Fig. 32 (a) Release profiles of PAM from solution-cast PAM-loaded PEC-0.9 particle films for
various samples. From bottom to top: Single cast PAM/PEC-1:4 (relative PAM/PEC content is
1:4) at 0.01 M; single cast PAM/PEC-1:20 at 0.002 M; and single cast PAM/PEC-1:20 at 0.01 M.
(From [149] with kind permission of Elsevier). (b) SFM images of a PAM/PEI-1:12 particle film
cast from 0.002 M PEC dispersions onto the Ge support before (left) and after (24 h in H 2 O,
pH ¼ 6) (right) PAM release. Weakly covered (top) and highly (bottom) covered regions are
shown. (c) Proposed model for the binding locations of PAM (green) at PEC particles consisting of
PEI (red) and cellulose sulfate (blue): (A) at cationic sites of primary PEC particles, (B) within
secondary PEC particles, and (C) within a surface aggregated PEC phase. (From [149] with kind
permission of Elsevier).
244
M. M€ uller
Curvature Correction of PECPEI-PAM/CS 1:12;ubernacht in H20;
stark belegt; Stelle3
Topography (Forward)
Curvature Correction of PECPEI-PAM/CS 1:12;Stelle 3: Stark beleght
Topography (Forward)
Curvature Correction of PECPEI-PAM/CS 1:12; Stelle2
Topography (Forward)
Curvature Correction of PECPEI-PAM/CS 1:12;
tiber nachit H20: Stelle 2
nm
nm nm
nm
3000
3000
2000
2000
1000
1000
0
90
80
70
60
50
40
30
20
10
0
100
0
0
4000
3000
3000
2000
2000
1000
1000
0
0
0
0
0
1000
1000
1000
2000
2000
2000
3000
3000
3000
0
1000
2000
3000
nm
nm
nm
nm
nm nm
nm
(A)
b
c
(B)
(C)
Fig. 32 (a) Release profiles of PAM from solution-cast PAM-loaded PEC-0.9 particle films for
various samples. From bottom to top: Single cast PAM/PEC-1:4 (relative PAM/PEC content is
1:4) at 0.01 M; single cast PAM/PEC-1:20 at 0.002 M; and single cast PAM/PEC-1:20 at 0.01 M.
(From [149] with kind permission of Elsevier). (b) SFM images of a PAM/PEI-1:12 particle film
cast from 0.002 M PEC dispersions onto the Ge support before (left) and after (24 h in H 2 O,
pH ¼ 6) (right) PAM release. Weakly covered (top) and highly (bottom) covered regions are
shown. (c) Proposed model for the binding locations of PAM (green) at PEC particles consisting of
PEI (red) and cellulose sulfate (blue): (A) at cationic sites of primary PEC particles, (B) within
secondary PEC particles, and (C) within a surface aggregated PEC phase. (From [149] with kind
permission of Elsevier).
244
M. M€ uller