

more than 10 times lower than that of branched PEI25K/DNA, which can be
explained by the inefficient pDNA condensation but also by reduced cellular uptake
and endosomal escape.
PDMAEMA-b-POEGMA (Fig. 12b), PDMAEMA-b-POEGMA-b-PDMAEMA
(Fig. 12c) with the same number of DMAEMA units (100), and POEGMA (66)
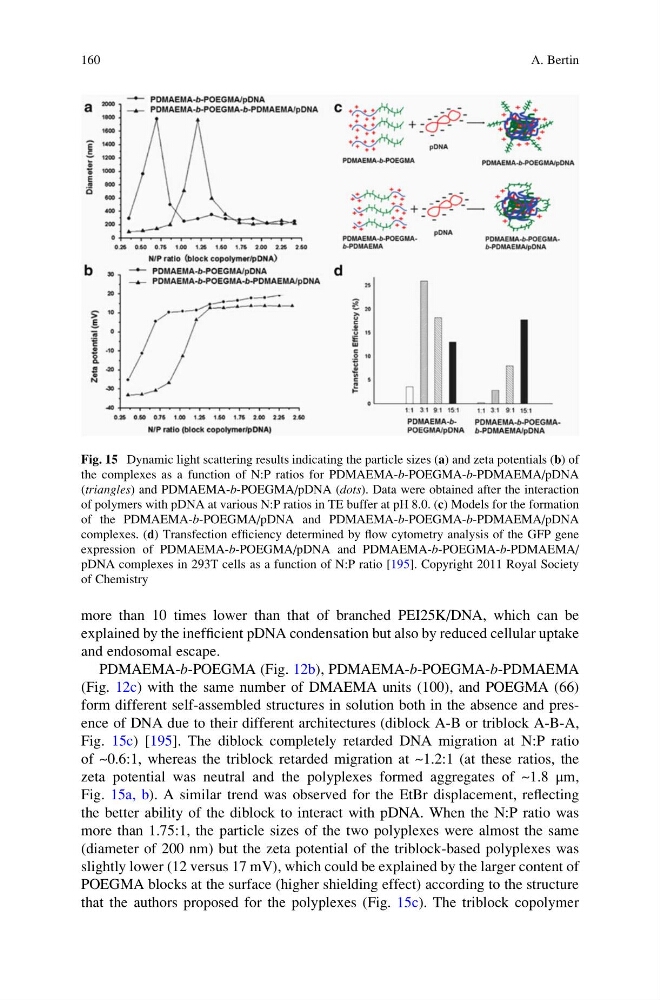
form different self-assembled structures in solution both in the absence and presence of DNA due to their different architectures (diblock A-B or triblock A-B-A,
Fig. 15c) [195]. The diblock completely retarded DNA migration at N:P ratio
of ~0.6:1, whereas the triblock retarded migration at ~1.2:1 (at these ratios, the
zeta potential was neutral and the polyplexes formed aggregates of ~1.8 μm,
Fig. 15a, b). A similar trend was observed for the EtBr displacement, reflecting
the better ability of the diblock to interact with pDNA. When the N:P ratio was
more than 1.75:1, the particle sizes of the two polyplexes were almost the same
(diameter of 200 nm) but the zeta potential of the triblock-based polyplexes was
slightly lower (12 versus 17 mV), which could be explained by the larger content of
POEGMA blocks at the surface (higher shielding effect) according to the structure
that the authors proposed for the polyplexes (Fig. 15c). The triblock copolymer
Fig. 15 Dynamic light scattering results indicating the particle sizes (a) and zeta potentials (b) of
the complexes as a function of N:P ratios for PDMAEMA-b-POEGMA-b-PDMAEMA/pDNA
(triangles) and PDMAEMA-b-POEGMA/pDNA (dots). Data were obtained after the interaction
of polymers with pDNA at various N:P ratios in TE buffer at pH 8.0. (c) Models for the formation
of the PDMAEMA-b-POEGMA/pDNA and PDMAEMA-b-POEGMA-b-PDMAEMA/pDNA
complexes. (d) Transfection efficiency determined by flow cytometry analysis of the GFP gene
expression of PDMAEMA-b-POEGMA/pDNA and PDMAEMA-b-POEGMA-b-PDMAEMA/
pDNA complexes in 293T cells as a function of N:P ratio [195]. Copyright 2011 Royal Society
of Chemistry
160
A. Bertin
explained by the inefficient pDNA condensation but also by reduced cellular uptake
and endosomal escape.
PDMAEMA-b-POEGMA (Fig. 12b), PDMAEMA-b-POEGMA-b-PDMAEMA
(Fig. 12c) with the same number of DMAEMA units (100), and POEGMA (66)
form different self-assembled structures in solution both in the absence and presence of DNA due to their different architectures (diblock A-B or triblock A-B-A,
Fig. 15c) [195]. The diblock completely retarded DNA migration at N:P ratio
of ~0.6:1, whereas the triblock retarded migration at ~1.2:1 (at these ratios, the
zeta potential was neutral and the polyplexes formed aggregates of ~1.8 μm,
Fig. 15a, b). A similar trend was observed for the EtBr displacement, reflecting
the better ability of the diblock to interact with pDNA. When the N:P ratio was
more than 1.75:1, the particle sizes of the two polyplexes were almost the same
(diameter of 200 nm) but the zeta potential of the triblock-based polyplexes was
slightly lower (12 versus 17 mV), which could be explained by the larger content of
POEGMA blocks at the surface (higher shielding effect) according to the structure
that the authors proposed for the polyplexes (Fig. 15c). The triblock copolymer
Fig. 15 Dynamic light scattering results indicating the particle sizes (a) and zeta potentials (b) of
the complexes as a function of N:P ratios for PDMAEMA-b-POEGMA-b-PDMAEMA/pDNA
(triangles) and PDMAEMA-b-POEGMA/pDNA (dots). Data were obtained after the interaction
of polymers with pDNA at various N:P ratios in TE buffer at pH 8.0. (c) Models for the formation
of the PDMAEMA-b-POEGMA/pDNA and PDMAEMA-b-POEGMA-b-PDMAEMA/pDNA
complexes. (d) Transfection efficiency determined by flow cytometry analysis of the GFP gene
expression of PDMAEMA-b-POEGMA/pDNA and PDMAEMA-b-POEGMA-b-PDMAEMA/
pDNA complexes in 293T cells as a function of N:P ratio [195]. Copyright 2011 Royal Society
of Chemistry
160
A. Bertin