

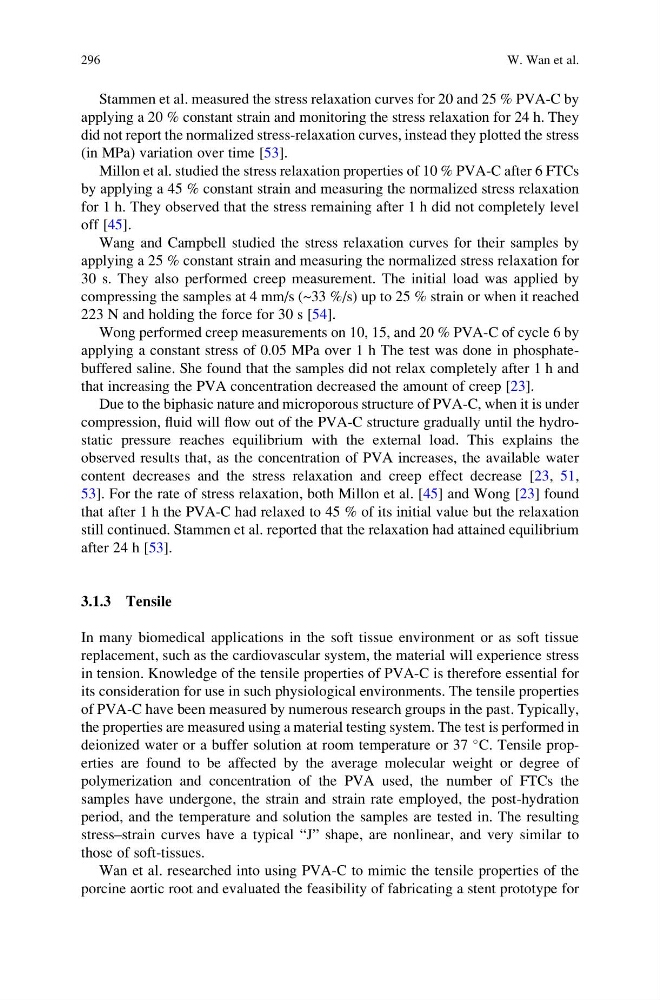
Stammen et al. measured the stress relaxation curves for 20 and 25 % PVA-C by
applying a 20 % constant strain and monitoring the stress relaxation for 24 h. They
did not report the normalized stress-relaxation curves, instead they plotted the stress
(in MPa) variation over time [53].
Millon et al. studied the stress relaxation properties of 10 % PVA-C after 6 FTCs
by applying a 45 % constant strain and measuring the normalized stress relaxation
for 1 h. They observed that the stress remaining after 1 h did not completely level
off [45].
Wang and Campbell studied the stress relaxation curves for their samples by
applying a 25 % constant strain and measuring the normalized stress relaxation for
30 s. They also performed creep measurement. The initial load was applied by
compressing the samples at 4 mm/s (~33 %/s) up to 25 % strain or when it reached
223 N and holding the force for 30 s [54].
Wong performed creep measurements on 10, 15, and 20 % PVA-C of cycle 6 by
applying a constant stress of 0.05 MPa over 1 h The test was done in phosphatebuffered saline. She found that the samples did not relax completely after 1 h and
that increasing the PVA concentration decreased the amount of creep [23].
Due to the biphasic nature and microporous structure of PVA-C, when it is under
compression, fluid will flow out of the PVA-C structure gradually until the hydrostatic pressure reaches equilibrium with the external load. This explains the
observed results that, as the concentration of PVA increases, the available water
content decreases and the stress relaxation and creep effect decrease [23, 51,
53]. For the rate of stress relaxation, both Millon et al. [45] and Wong [23] found
that after 1 h the PVA-C had relaxed to 45 % of its initial value but the relaxation
still continued. Stammen et al. reported that the relaxation had attained equilibrium
after 24 h [53].
3.1.3 Tensile
In many biomedical applications in the soft tissue environment or as soft tissue
replacement, such as the cardiovascular system, the material will experience stress
in tension. Knowledge of the tensile properties of PVA-C is therefore essential for
its consideration for use in such physiological environments. The tensile properties
of PVA-C have been measured by numerous research groups in the past. Typically,
the properties are measured using a material testing system. The test is performed in
deionized water or a buffer solution at room temperature or 37
C. Tensile properties are found to be affected by the average molecular weight or degree of
polymerization and concentration of the PVA used, the number of FTCs the
samples have undergone, the strain and strain rate employed, the post-hydration
period, and the temperature and solution the samples are tested in. The resulting
stress–strain curves have a typical “J” shape, are nonlinear, and very similar to
those of soft-tissues.
Wan et al. researched into using PVA-C to mimic the tensile properties of the
porcine aortic root and evaluated the feasibility of fabricating a stent prototype for
296
W. Wan et al.
applying a 20 % constant strain and monitoring the stress relaxation for 24 h. They
did not report the normalized stress-relaxation curves, instead they plotted the stress
(in MPa) variation over time [53].
Millon et al. studied the stress relaxation properties of 10 % PVA-C after 6 FTCs
by applying a 45 % constant strain and measuring the normalized stress relaxation
for 1 h. They observed that the stress remaining after 1 h did not completely level
off [45].
Wang and Campbell studied the stress relaxation curves for their samples by
applying a 25 % constant strain and measuring the normalized stress relaxation for
30 s. They also performed creep measurement. The initial load was applied by
compressing the samples at 4 mm/s (~33 %/s) up to 25 % strain or when it reached
223 N and holding the force for 30 s [54].
Wong performed creep measurements on 10, 15, and 20 % PVA-C of cycle 6 by
applying a constant stress of 0.05 MPa over 1 h The test was done in phosphatebuffered saline. She found that the samples did not relax completely after 1 h and
that increasing the PVA concentration decreased the amount of creep [23].
Due to the biphasic nature and microporous structure of PVA-C, when it is under
compression, fluid will flow out of the PVA-C structure gradually until the hydrostatic pressure reaches equilibrium with the external load. This explains the
observed results that, as the concentration of PVA increases, the available water
content decreases and the stress relaxation and creep effect decrease [23, 51,
53]. For the rate of stress relaxation, both Millon et al. [45] and Wong [23] found
that after 1 h the PVA-C had relaxed to 45 % of its initial value but the relaxation
still continued. Stammen et al. reported that the relaxation had attained equilibrium
after 24 h [53].
3.1.3 Tensile
In many biomedical applications in the soft tissue environment or as soft tissue
replacement, such as the cardiovascular system, the material will experience stress
in tension. Knowledge of the tensile properties of PVA-C is therefore essential for
its consideration for use in such physiological environments. The tensile properties
of PVA-C have been measured by numerous research groups in the past. Typically,
the properties are measured using a material testing system. The test is performed in
deionized water or a buffer solution at room temperature or 37
C. Tensile properties are found to be affected by the average molecular weight or degree of
polymerization and concentration of the PVA used, the number of FTCs the
samples have undergone, the strain and strain rate employed, the post-hydration
period, and the temperature and solution the samples are tested in. The resulting
stress–strain curves have a typical “J” shape, are nonlinear, and very similar to
those of soft-tissues.
Wan et al. researched into using PVA-C to mimic the tensile properties of the
porcine aortic root and evaluated the feasibility of fabricating a stent prototype for
296
W. Wan et al.