

Based on data obtained by cryogenic transmission electron microscopy (cryoTEM), solid-state NMR, X-ray scattering, and DSC, Willcox et al. [61] proposed a
model for PVA cryogels similar to that proposed by Yokoyama (Fig. 11) [49]. In
particular, they showed that during the first freeze–thaw cycle a few small crystallites are formed (with size of about 3–8 nm), which are connected in an irregular
porous network by amorphous chains highly swollen by the solvent. They found
that the average crystal–crystal distance (mesh size) is %30 nm. Upon aging these
gels, or by subjecting them to a second freeze–thaw cycle, the level of crystallinity
increases, whereas the crystallite size and the mesh size remain nearly constant.
This suggests that the formation of secondary crystallites does not affect the
network connectivity. Cryo-TEM observation of these gels essentially confirmed
the presence of pores located at the same mesh distance as crystallites [61]. Therefore, Willcox and colleagues [61] point out the existence of pores sized one order of
magnitude lower than the macropores visualized in other investigations [49, 59]
(Fig. 12). We infer that these pores are formed inside the polymer-rich regions and
coexist with the macropores. The possible mechanism of formation of these gels,
involving dendritic ice crystallization and possibly spinodal decomposition, are
also discussed [61].
Our group has used TR-SANS to perform extensive investigations on the
cryotropic gelation of PVA/D 2 O solutions during consecutive freeze–thaw cycles
[76, 77]. Measurements have been performed on solutions of 5.03, 10.11, and
14.22 wt% PVA, corresponding to PVA volume fractions Φ of 0.042, 0.086, and
0.12, respectively. In Fig. 16a, the SANS data collected during the freezing
(at –13
C) and thawing (at 20
C) steps are shown for a solution with PVA volume
fraction Φ ¼ 0.086 [76, 77] as an example.
The scattering cross-section increases during freezing (Fig. 16a). This increase is
essentially due to structural changes associated with the crystallization of the
water in the solution. Nearly constant values are achieved for the frozen solution
after 30 min at À13
C (curve d in Fig. 16a). The presence of a knee at
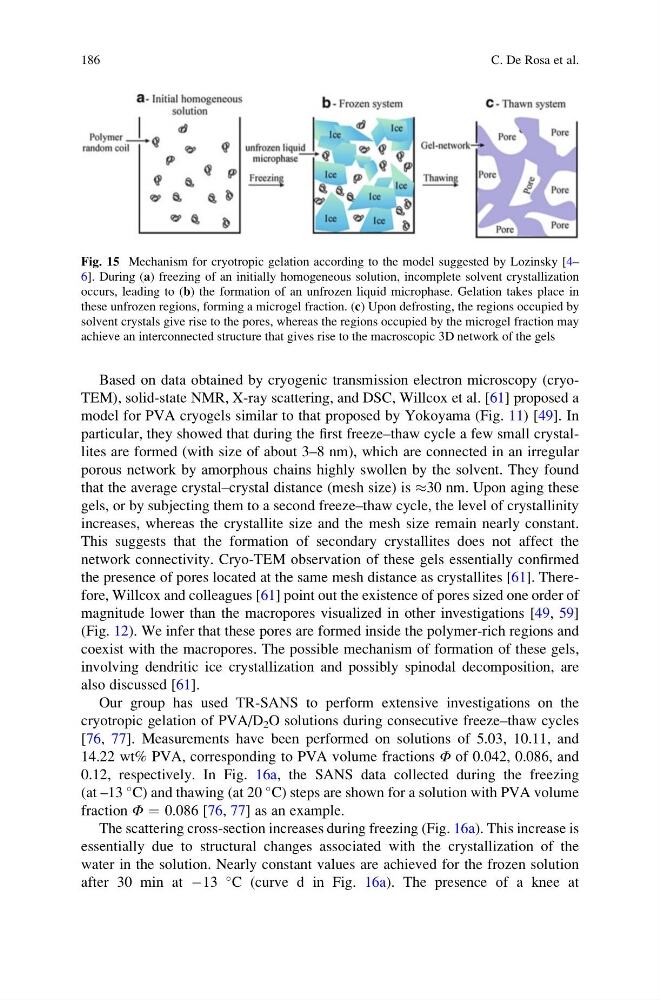
Fig. 15 Mechanism for cryotropic gelation according to the model suggested by Lozinsky [4–
6]. During (a) freezing of an initially homogeneous solution, incomplete solvent crystallization
occurs, leading to (b) the formation of an unfrozen liquid microphase. Gelation takes place in
these unfrozen regions, forming a microgel fraction. (c) Upon defrosting, the regions occupied by
solvent crystals give rise to the pores, whereas the regions occupied by the microgel fraction may
achieve an interconnected structure that gives rise to the macroscopic 3D network of the gels
186
C. De Rosa et al.
model for PVA cryogels similar to that proposed by Yokoyama (Fig. 11) [49]. In
particular, they showed that during the first freeze–thaw cycle a few small crystallites are formed (with size of about 3–8 nm), which are connected in an irregular
porous network by amorphous chains highly swollen by the solvent. They found
that the average crystal–crystal distance (mesh size) is %30 nm. Upon aging these
gels, or by subjecting them to a second freeze–thaw cycle, the level of crystallinity
increases, whereas the crystallite size and the mesh size remain nearly constant.
This suggests that the formation of secondary crystallites does not affect the
network connectivity. Cryo-TEM observation of these gels essentially confirmed
the presence of pores located at the same mesh distance as crystallites [61]. Therefore, Willcox and colleagues [61] point out the existence of pores sized one order of
magnitude lower than the macropores visualized in other investigations [49, 59]
(Fig. 12). We infer that these pores are formed inside the polymer-rich regions and
coexist with the macropores. The possible mechanism of formation of these gels,
involving dendritic ice crystallization and possibly spinodal decomposition, are
also discussed [61].
Our group has used TR-SANS to perform extensive investigations on the
cryotropic gelation of PVA/D 2 O solutions during consecutive freeze–thaw cycles
[76, 77]. Measurements have been performed on solutions of 5.03, 10.11, and
14.22 wt% PVA, corresponding to PVA volume fractions Φ of 0.042, 0.086, and
0.12, respectively. In Fig. 16a, the SANS data collected during the freezing
(at –13
C) and thawing (at 20
C) steps are shown for a solution with PVA volume
fraction Φ ¼ 0.086 [76, 77] as an example.
The scattering cross-section increases during freezing (Fig. 16a). This increase is
essentially due to structural changes associated with the crystallization of the
water in the solution. Nearly constant values are achieved for the frozen solution
after 30 min at À13
C (curve d in Fig. 16a). The presence of a knee at
Fig. 15 Mechanism for cryotropic gelation according to the model suggested by Lozinsky [4–
6]. During (a) freezing of an initially homogeneous solution, incomplete solvent crystallization
occurs, leading to (b) the formation of an unfrozen liquid microphase. Gelation takes place in
these unfrozen regions, forming a microgel fraction. (c) Upon defrosting, the regions occupied by
solvent crystals give rise to the pores, whereas the regions occupied by the microgel fraction may
achieve an interconnected structure that gives rise to the macroscopic 3D network of the gels
186
C. De Rosa et al.