

It was shown that the critical stress σ p corresponding to the plateau regime in the
stress–strain curves of cryogel scaffolds increases with decreasing pore diameter,
that is, with decreasing gelation temperature T prep or with increasing fibroin or
EGDE concentrations [50]. Figure 19a shows the stress–strain curves of cryogel
scaffolds formed at T prep ¼ À18
C and at three different fibroin concentrations
C SF . Inspection of the curves reveals that the critical stress σ p increases from 0.6 to
4.4 MPa with increasing fibroin concentration C SF from 4.2 to 12.6 %, i.e., with
decreasing pore diameter from 33 to 10 μm (Fig. 15). The results suggest an
increasing mechanical stability of the porous structure of fibroin scaffolds with
decreasing size of the pores. Indeed, the compressive modulus and the compressive
stress measurements of the scaffolds support this finding. The cryogel scaffolds
formed at T prep ¼ À18
C and C SF ¼ 4.2 % exhibit a compressive modulus E of
8 Æ 1 MPa, with a compressive nominal stress σ comp of 0.22 Æ 0.04 MPa. These
values are about one order of magnitude higher than those of the hydrogel scaffolds
formed at T prep ¼ 50
C. As illustrated in Fig. 19b, the modulus E and the
compressive stress σ comp further increase to 48 and 1 MPa, respectively, as C SF is
increased from 4.2 to 12.6 %.
We have to mention that fibroin scaffolds formed by freeze-drying of fibroin
solutions pretreated with alcohols exhibit compression moduli of 10–100 kPa,
whereas the salt leaching method generates scaffolds with a modulus of 0.5 MPa
[137]. The largest compressive modulus and compressive strength reported so far
2 theta
5
10
15
20
25
30
35
Intensity / a.u
Wavenumber / cm -1
1600 1620 1640 1660 1680 1700
Absorbance / a.u
1620
1640
1660
1698
b
0.07
0.33
0.17
0.10
0.50
20.9
9.8
24.5
a
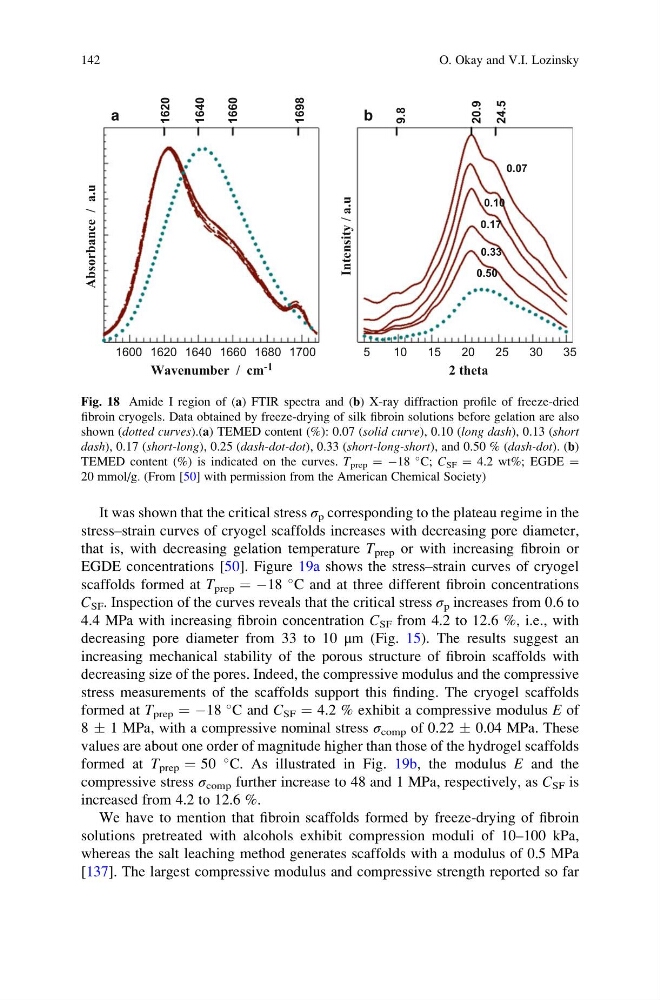
Fig. 18 Amide I region of (a) FTIR spectra and (b) X-ray diffraction profile of freeze-dried
fibroin cryogels. Data obtained by freeze-drying of silk fibroin solutions before gelation are also
shown (dotted curves).(a) TEMED content (%): 0.07 (solid curve), 0.10 (long dash), 0.13 (short
dash), 0.17 (short-long), 0.25 (dash-dot-dot), 0.33 (short-long-short), and 0.50 % (dash-dot). (b)
TEMED content (%) is indicated on the curves. T prep ¼ À18
C; C SF ¼ 4.2 wt%; EGDE ¼
20 mmol/g. (From [50] with permission from the American Chemical Society)
142
O. Okay and V.I. Lozinsky
stress–strain curves of cryogel scaffolds increases with decreasing pore diameter,
that is, with decreasing gelation temperature T prep or with increasing fibroin or
EGDE concentrations [50]. Figure 19a shows the stress–strain curves of cryogel
scaffolds formed at T prep ¼ À18
C and at three different fibroin concentrations
C SF . Inspection of the curves reveals that the critical stress σ p increases from 0.6 to
4.4 MPa with increasing fibroin concentration C SF from 4.2 to 12.6 %, i.e., with
decreasing pore diameter from 33 to 10 μm (Fig. 15). The results suggest an
increasing mechanical stability of the porous structure of fibroin scaffolds with
decreasing size of the pores. Indeed, the compressive modulus and the compressive
stress measurements of the scaffolds support this finding. The cryogel scaffolds
formed at T prep ¼ À18
C and C SF ¼ 4.2 % exhibit a compressive modulus E of
8 Æ 1 MPa, with a compressive nominal stress σ comp of 0.22 Æ 0.04 MPa. These
values are about one order of magnitude higher than those of the hydrogel scaffolds
formed at T prep ¼ 50
C. As illustrated in Fig. 19b, the modulus E and the
compressive stress σ comp further increase to 48 and 1 MPa, respectively, as C SF is
increased from 4.2 to 12.6 %.
We have to mention that fibroin scaffolds formed by freeze-drying of fibroin
solutions pretreated with alcohols exhibit compression moduli of 10–100 kPa,
whereas the salt leaching method generates scaffolds with a modulus of 0.5 MPa
[137]. The largest compressive modulus and compressive strength reported so far
2 theta
5
10
15
20
25
30
35
Intensity / a.u
Wavenumber / cm -1
1600 1620 1640 1660 1680 1700
Absorbance / a.u
1620
1640
1660
1698
b
0.07
0.33
0.17
0.10
0.50
20.9
9.8
24.5
a
Fig. 18 Amide I region of (a) FTIR spectra and (b) X-ray diffraction profile of freeze-dried
fibroin cryogels. Data obtained by freeze-drying of silk fibroin solutions before gelation are also
shown (dotted curves).(a) TEMED content (%): 0.07 (solid curve), 0.10 (long dash), 0.13 (short
dash), 0.17 (short-long), 0.25 (dash-dot-dot), 0.33 (short-long-short), and 0.50 % (dash-dot). (b)
TEMED content (%) is indicated on the curves. T prep ¼ À18
C; C SF ¼ 4.2 wt%; EGDE ¼
20 mmol/g. (From [50] with permission from the American Chemical Society)
142
O. Okay and V.I. Lozinsky