

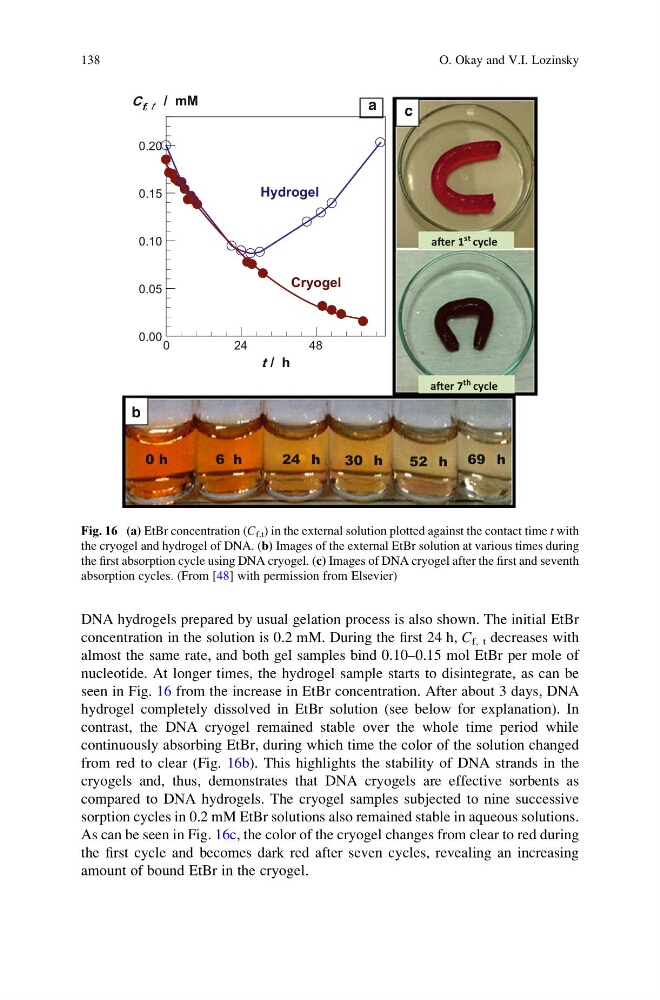
DNA hydrogels prepared by usual gelation process is also shown. The initial EtBr
concentration in the solution is 0.2 mM. During the first 24 h, C f, t decreases with
almost the same rate, and both gel samples bind 0.10–0.15 mol EtBr per mole of
nucleotide. At longer times, the hydrogel sample starts to disintegrate, as can be
seen in Fig. 16 from the increase in EtBr concentration. After about 3 days, DNA
hydrogel completely dissolved in EtBr solution (see below for explanation). In
contrast, the DNA cryogel remained stable over the whole time period while
continuously absorbing EtBr, during which time the color of the solution changed
from red to clear (Fig. 16b). This highlights the stability of DNA strands in the
cryogels and, thus, demonstrates that DNA cryogels are effective sorbents as
compared to DNA hydrogels. The cryogel samples subjected to nine successive
sorption cycles in 0.2 mM EtBr solutions also remained stable in aqueous solutions.
As can be seen in Fig. 16c, the color of the cryogel changes from clear to red during
the first cycle and becomes dark red after seven cycles, revealing an increasing
amount of bound EtBr in the cryogel.
t / h
0
2 4
4 8
C f, t / mM
0.00
0.05
0.10
0.15
0.20
Cryogel
Hydrogel
a
0 h
6 h
24 h
30 h
52 h 69 h
c
b
aŌer 1 st cycle
aŌer 7
th cycle
Fig. 16 (a) EtBr concentration (C f,t ) in the external solution plotted against the contact time t with
the cryogel and hydrogel of DNA. (b) Images of the external EtBr solution at various times during
the first absorption cycle using DNA cryogel. (c) Images of DNA cryogel after the first and seventh
absorption cycles. (From [48] with permission from Elsevier)
138
O. Okay and V.I. Lozinsky
concentration in the solution is 0.2 mM. During the first 24 h, C f, t decreases with
almost the same rate, and both gel samples bind 0.10–0.15 mol EtBr per mole of
nucleotide. At longer times, the hydrogel sample starts to disintegrate, as can be
seen in Fig. 16 from the increase in EtBr concentration. After about 3 days, DNA
hydrogel completely dissolved in EtBr solution (see below for explanation). In
contrast, the DNA cryogel remained stable over the whole time period while
continuously absorbing EtBr, during which time the color of the solution changed
from red to clear (Fig. 16b). This highlights the stability of DNA strands in the
cryogels and, thus, demonstrates that DNA cryogels are effective sorbents as
compared to DNA hydrogels. The cryogel samples subjected to nine successive
sorption cycles in 0.2 mM EtBr solutions also remained stable in aqueous solutions.
As can be seen in Fig. 16c, the color of the cryogel changes from clear to red during
the first cycle and becomes dark red after seven cycles, revealing an increasing
amount of bound EtBr in the cryogel.
t / h
0
2 4
4 8
C f, t / mM
0.00
0.05
0.10
0.15
0.20
Cryogel
Hydrogel
a
0 h
6 h
24 h
30 h
52 h 69 h
c
b
aŌer 1 st cycle
aŌer 7
th cycle
Fig. 16 (a) EtBr concentration (C f,t ) in the external solution plotted against the contact time t with
the cryogel and hydrogel of DNA. (b) Images of the external EtBr solution at various times during
the first absorption cycle using DNA cryogel. (c) Images of DNA cryogel after the first and seventh
absorption cycles. (From [48] with permission from Elsevier)
138
O. Okay and V.I. Lozinsky