

4.2 Monomer or Polymer Concentration
It was observed that the architecture or morphology of the cryogel network essentially does not depend on monomer concentration, whereas the size of the structure
responds sensitively. In PAAm cryogels, the average pore diameter was found to
decrease from 55 to 10 μm with increasing monomer concentration from 3 to 30 %
[26]. At the same time, the average thickness of the pore walls increased from 3 to
15 μm. In PAAm cryogels with functional epoxy groups, Plieva et al. also reported
decreasing pore size but increasing thickness of pore walls with increasing monomer concentration from 6 to 22 % at T prep ¼ À12
C [24]. Kirsebom et al. also
showed that larger pores and thinner pore walls in poly(DMA) (PDMA) cryogels
can be produced from 3 wt% monomer concentration as compared to 12 wt%
[28]. In contrast, however, an increasing pore size with increasing concentration
was reported for PAMPS hydrogels obtained at T prep ¼ À22
C [63]. This finding is
attributed to collapse of the large pores in such polyelectrolyte gels formed at low
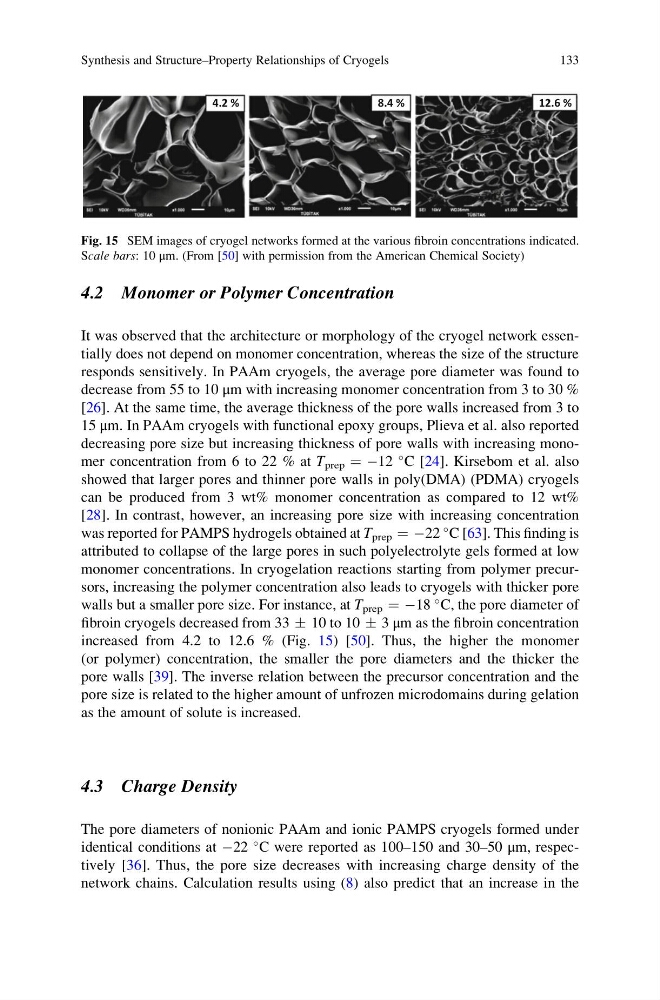
monomer concentrations. In cryogelation reactions starting from polymer precursors, increasing the polymer concentration also leads to cryogels with thicker pore
walls but a smaller pore size. For instance, at T prep ¼ À18
C, the pore diameter of
fibroin cryogels decreased from 33 Æ 10 to 10 Æ 3 μm as the fibroin concentration
increased from 4.2 to 12.6 % (Fig. 15) [50]. Thus, the higher the monomer
(or polymer) concentration, the smaller the pore diameters and the thicker the
pore walls [39]. The inverse relation between the precursor concentration and the
pore size is related to the higher amount of unfrozen microdomains during gelation
as the amount of solute is increased.
4.3 Charge Density
The pore diameters of nonionic PAAm and ionic PAMPS cryogels formed under
identical conditions at À22
C were reported as 100–150 and 30–50 μm, respectively [36]. Thus, the pore size decreases with increasing charge density of the
network chains. Calculation results using (8) also predict that an increase in the
8.4 %
4.2 %
12.6 %
Fig. 15 SEM images of cryogel networks formed at the various fibroin concentrations indicated.
Scale bars: 10 μm. (From [50] with permission from the American Chemical Society)
Synthesis and Structure–Property Relationships of Cryogels
133
It was observed that the architecture or morphology of the cryogel network essentially does not depend on monomer concentration, whereas the size of the structure
responds sensitively. In PAAm cryogels, the average pore diameter was found to
decrease from 55 to 10 μm with increasing monomer concentration from 3 to 30 %
[26]. At the same time, the average thickness of the pore walls increased from 3 to
15 μm. In PAAm cryogels with functional epoxy groups, Plieva et al. also reported
decreasing pore size but increasing thickness of pore walls with increasing monomer concentration from 6 to 22 % at T prep ¼ À12
C [24]. Kirsebom et al. also
showed that larger pores and thinner pore walls in poly(DMA) (PDMA) cryogels
can be produced from 3 wt% monomer concentration as compared to 12 wt%
[28]. In contrast, however, an increasing pore size with increasing concentration
was reported for PAMPS hydrogels obtained at T prep ¼ À22
C [63]. This finding is
attributed to collapse of the large pores in such polyelectrolyte gels formed at low
monomer concentrations. In cryogelation reactions starting from polymer precursors, increasing the polymer concentration also leads to cryogels with thicker pore
walls but a smaller pore size. For instance, at T prep ¼ À18
C, the pore diameter of
fibroin cryogels decreased from 33 Æ 10 to 10 Æ 3 μm as the fibroin concentration
increased from 4.2 to 12.6 % (Fig. 15) [50]. Thus, the higher the monomer
(or polymer) concentration, the smaller the pore diameters and the thicker the
pore walls [39]. The inverse relation between the precursor concentration and the
pore size is related to the higher amount of unfrozen microdomains during gelation
as the amount of solute is increased.
4.3 Charge Density
The pore diameters of nonionic PAAm and ionic PAMPS cryogels formed under
identical conditions at À22
C were reported as 100–150 and 30–50 μm, respectively [36]. Thus, the pore size decreases with increasing charge density of the
network chains. Calculation results using (8) also predict that an increase in the
8.4 %
4.2 %
12.6 %
Fig. 15 SEM images of cryogel networks formed at the various fibroin concentrations indicated.
Scale bars: 10 μm. (From [50] with permission from the American Chemical Society)
Synthesis and Structure–Property Relationships of Cryogels
133