

the reaction solution, the system was immediately cooled down to À196
C using
liquid nitrogen and, then, the system was immersed into a thermostat at T prep ¼
À2
C. The reactions before reaching À2
C were very slow such that a near
isothermal condition was provided. No such precooling step was applied for the
preparation of the usual gel sample (N-gel). Although the initial diameters of both
gel samples after their preparation were the same (4.3 mm), the swollen volume of
N-gel was about tenfold larger than the volume of I-gel. Further, the N-gel was
transparent while the I-gel was opaque, both after preparation and after equilibrium
swelling in water. The magnified images of the equilibrium swollen gel samples
taken with an optical microscope also illustrate the structural differences between
the two gel samples (Fig. 10b). Whereas the N-gel was homogeneous in the swollen
state, the I-gel exhibited a discontinuous morphology consisting of solvent and gel
domains. This means that N- and I-gels prepared at the same T prep are formed in
homogeneous gelation and cryogelation regimes, respectively.
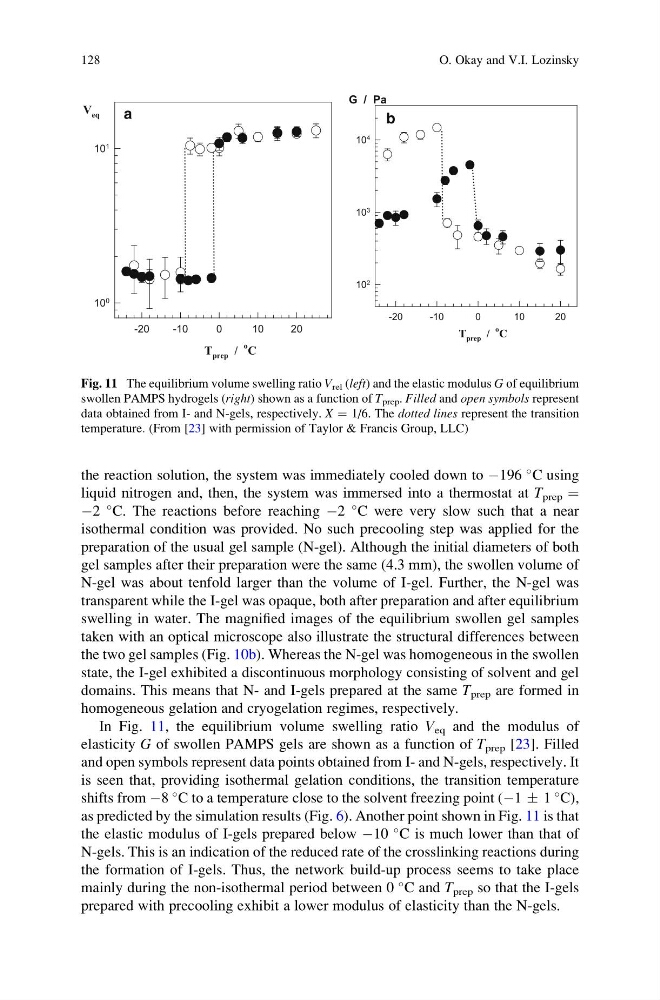
In Fig. 11, the equilibrium volume swelling ratio V eq and the modulus of
elasticity G of swollen PAMPS gels are shown as a function of T prep [23]. Filled
and open symbols represent data points obtained from I- and N-gels, respectively. It
is seen that, providing isothermal gelation conditions, the transition temperature
shifts from À8
C to a temperature close to the solvent freezing point (À1 Æ 1
C),
as predicted by the simulation results (Fig. 6). Another point shown in Fig. 11 is that
the elastic modulus of I-gels prepared below À10
C is much lower than that of
N-gels. This is an indication of the reduced rate of the crosslinking reactions during
the formation of I-gels. Thus, the network build-up process seems to take place
mainly during the non-isothermal period between 0
C and T prep so that the I-gels
prepared with precooling exhibit a lower modulus of elasticity than the N-gels.
T prep /
o C
-20
-10
0
10
20
V eq
10
0
10
1
a
T prep /
o C
-20
-10
0
10
20
G / Pa
10
2
10
3
10
4
b
Fig. 11 The equilibrium volume swelling ratio V rel (left) and the elastic modulus G of equilibrium
swollen PAMPS hydrogels (right) shown as a function of T prep . Filled and open symbols represent
data obtained from I- and N-gels, respectively. X ¼ 1/6. The dotted lines represent the transition
temperature. (From [23] with permission of Taylor & Francis Group, LLC)
128
O. Okay and V.I. Lozinsky
C using
liquid nitrogen and, then, the system was immersed into a thermostat at T prep ¼
À2
C. The reactions before reaching À2
C were very slow such that a near
isothermal condition was provided. No such precooling step was applied for the
preparation of the usual gel sample (N-gel). Although the initial diameters of both
gel samples after their preparation were the same (4.3 mm), the swollen volume of
N-gel was about tenfold larger than the volume of I-gel. Further, the N-gel was
transparent while the I-gel was opaque, both after preparation and after equilibrium
swelling in water. The magnified images of the equilibrium swollen gel samples
taken with an optical microscope also illustrate the structural differences between
the two gel samples (Fig. 10b). Whereas the N-gel was homogeneous in the swollen
state, the I-gel exhibited a discontinuous morphology consisting of solvent and gel
domains. This means that N- and I-gels prepared at the same T prep are formed in
homogeneous gelation and cryogelation regimes, respectively.
In Fig. 11, the equilibrium volume swelling ratio V eq and the modulus of
elasticity G of swollen PAMPS gels are shown as a function of T prep [23]. Filled
and open symbols represent data points obtained from I- and N-gels, respectively. It
is seen that, providing isothermal gelation conditions, the transition temperature
shifts from À8
C to a temperature close to the solvent freezing point (À1 Æ 1
C),
as predicted by the simulation results (Fig. 6). Another point shown in Fig. 11 is that
the elastic modulus of I-gels prepared below À10
C is much lower than that of
N-gels. This is an indication of the reduced rate of the crosslinking reactions during
the formation of I-gels. Thus, the network build-up process seems to take place
mainly during the non-isothermal period between 0
C and T prep so that the I-gels
prepared with precooling exhibit a lower modulus of elasticity than the N-gels.
T prep /
o C
-20
-10
0
10
20
V eq
10
0
10
1
a
T prep /
o C
-20
-10
0
10
20
G / Pa
10
2
10
3
10
4
b
Fig. 11 The equilibrium volume swelling ratio V rel (left) and the elastic modulus G of equilibrium
swollen PAMPS hydrogels (right) shown as a function of T prep . Filled and open symbols represent
data obtained from I- and N-gels, respectively. X ¼ 1/6. The dotted lines represent the transition
temperature. (From [23] with permission of Taylor & Francis Group, LLC)
128
O. Okay and V.I. Lozinsky