

almost unchanged as T prep is decreased below À6
C while the volume swelling
ratio q v rapidly decreases. At T prep À10
C, the gels swell about sixfold more
by weight than by volume. According to (4), these results suggest the appearance
of pores in the gel matrices prepared at T prep À10
C.
Indeed, the gels formed at T prep ! À6
C were transparent, whereas those
formed below –6
C were opaque and exhibited 85 % porosities [26]. The total
volume of pores, V p , of the hydrogels estimated from the uptake of a poor solvent
(cyclohexane) was in the range of 3–6 mL/g for the gels prepared below À6
C,
whereas those formed at higher temperatures exhibited negligible pore volumes.
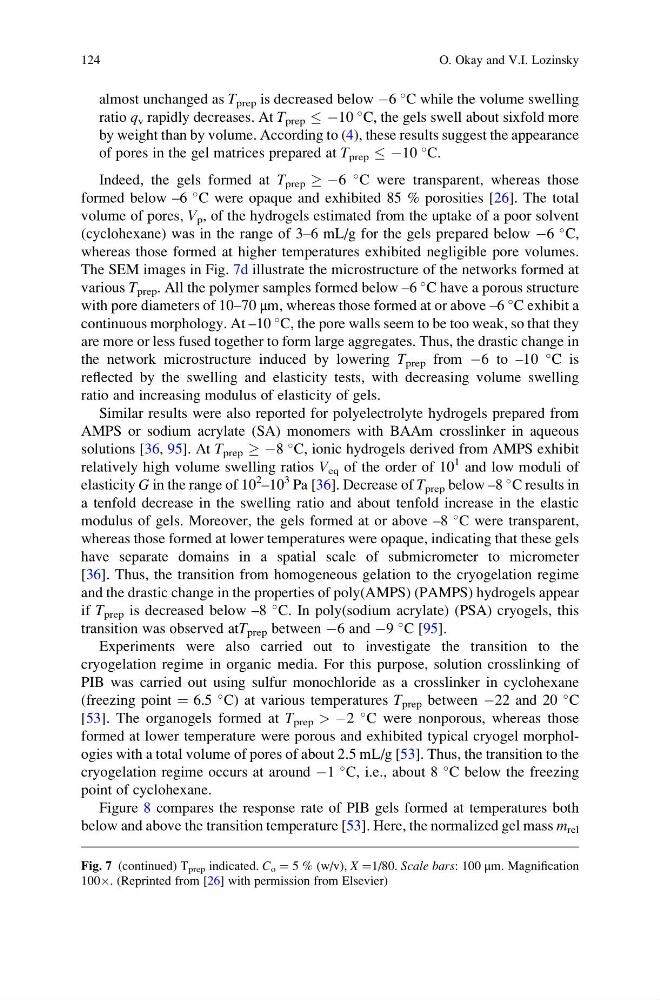
The SEM images in Fig. 7d illustrate the microstructure of the networks formed at
various T prep . All the polymer samples formed below –6
C have a porous structure
with pore diameters of 10–70 μm, whereas those formed at or above –6
C exhibit a
continuous morphology. At –10
C, the pore walls seem to be too weak, so that they
are more or less fused together to form large aggregates. Thus, the drastic change in
the network microstructure induced by lowering T prep from À6 to –10
C is
reflected by the swelling and elasticity tests, with decreasing volume swelling
ratio and increasing modulus of elasticity of gels.
Similar results were also reported for polyelectrolyte hydrogels prepared from
AMPS or sodium acrylate (SA) monomers with BAAm crosslinker in aqueous
solutions [36, 95]. At T prep ! À8
C, ionic hydrogels derived from AMPS exhibit
relatively high volume swelling ratios V eq of the order of 10
1 and low moduli of
elasticity G in the range of 10
2 –10
3 Pa [36]. Decrease of T prep below –8
C results in
a tenfold decrease in the swelling ratio and about tenfold increase in the elastic
modulus of gels. Moreover, the gels formed at or above –8
C were transparent,
whereas those formed at lower temperatures were opaque, indicating that these gels
have separate domains in a spatial scale of submicrometer to micrometer
[36]. Thus, the transition from homogeneous gelation to the cryogelation regime
and the drastic change in the properties of poly(AMPS) (PAMPS) hydrogels appear
if T prep is decreased below –8
C. In poly(sodium acrylate) (PSA) cryogels, this
transition was observed atT prep between À6 and À9
C [95].
Experiments were also carried out to investigate the transition to the
cryogelation regime in organic media. For this purpose, solution crosslinking of
PIB was carried out using sulfur monochloride as a crosslinker in cyclohexane
(freezing point ¼ 6.5
C) at various temperatures T prep between À22 and 20
C
[53]. The organogels formed at T prep > À2
C were nonporous, whereas those
formed at lower temperature were porous and exhibited typical cryogel morphologies with a total volume of pores of about 2.5 mL/g [53]. Thus, the transition to the
cryogelation regime occurs at around À1
C, i.e., about 8
C below the freezing
point of cyclohexane.
Figure 8 compares the response rate of PIB gels formed at temperatures both
below and above the transition temperature [53]. Here, the normalized gel mass m rel
Fig. 7 (continued) T prep indicated. C o ¼ 5 % (w/v), X ¼1/80. Scale bars: 100 μm. Magnification
100Â. (Reprinted from [26] with permission from Elsevier)
124
O. Okay and V.I. Lozinsky
C while the volume swelling
ratio q v rapidly decreases. At T prep À10
C, the gels swell about sixfold more
by weight than by volume. According to (4), these results suggest the appearance
of pores in the gel matrices prepared at T prep À10
C.
Indeed, the gels formed at T prep ! À6
C were transparent, whereas those
formed below –6
C were opaque and exhibited 85 % porosities [26]. The total
volume of pores, V p , of the hydrogels estimated from the uptake of a poor solvent
(cyclohexane) was in the range of 3–6 mL/g for the gels prepared below À6
C,
whereas those formed at higher temperatures exhibited negligible pore volumes.
The SEM images in Fig. 7d illustrate the microstructure of the networks formed at
various T prep . All the polymer samples formed below –6
C have a porous structure
with pore diameters of 10–70 μm, whereas those formed at or above –6
C exhibit a
continuous morphology. At –10
C, the pore walls seem to be too weak, so that they
are more or less fused together to form large aggregates. Thus, the drastic change in
the network microstructure induced by lowering T prep from À6 to –10
C is
reflected by the swelling and elasticity tests, with decreasing volume swelling
ratio and increasing modulus of elasticity of gels.
Similar results were also reported for polyelectrolyte hydrogels prepared from
AMPS or sodium acrylate (SA) monomers with BAAm crosslinker in aqueous
solutions [36, 95]. At T prep ! À8
C, ionic hydrogels derived from AMPS exhibit
relatively high volume swelling ratios V eq of the order of 10
1 and low moduli of
elasticity G in the range of 10
2 –10
3 Pa [36]. Decrease of T prep below –8
C results in
a tenfold decrease in the swelling ratio and about tenfold increase in the elastic
modulus of gels. Moreover, the gels formed at or above –8
C were transparent,
whereas those formed at lower temperatures were opaque, indicating that these gels
have separate domains in a spatial scale of submicrometer to micrometer
[36]. Thus, the transition from homogeneous gelation to the cryogelation regime
and the drastic change in the properties of poly(AMPS) (PAMPS) hydrogels appear
if T prep is decreased below –8
C. In poly(sodium acrylate) (PSA) cryogels, this
transition was observed atT prep between À6 and À9
C [95].
Experiments were also carried out to investigate the transition to the
cryogelation regime in organic media. For this purpose, solution crosslinking of
PIB was carried out using sulfur monochloride as a crosslinker in cyclohexane
(freezing point ¼ 6.5
C) at various temperatures T prep between À22 and 20
C
[53]. The organogels formed at T prep > À2
C were nonporous, whereas those
formed at lower temperature were porous and exhibited typical cryogel morphologies with a total volume of pores of about 2.5 mL/g [53]. Thus, the transition to the
cryogelation regime occurs at around À1
C, i.e., about 8
C below the freezing
point of cyclohexane.
Figure 8 compares the response rate of PIB gels formed at temperatures both
below and above the transition temperature [53]. Here, the normalized gel mass m rel
Fig. 7 (continued) T prep indicated. C o ¼ 5 % (w/v), X ¼1/80. Scale bars: 100 μm. Magnification
100Â. (Reprinted from [26] with permission from Elsevier)
124
O. Okay and V.I. Lozinsky