

obtained for both hydrophilic and hydrophobic cryogel beads [47, 69, 73]. It was
shown that the modulus (i.e., the effective crosslink density of the cryogel beads)
decreases with decreasing bead diameter [73]. This size-dependent crosslink density of the beads is attributed to the fact that the gelation reactions at the surface
layer of the droplets slow down due to the contact of this region with the continuous
phase. This will reduce the crosslink density of the surface layer of the resulting gel
beads. Since decreasing the size of the droplets increases the surface-to-volume
ratio of the final beads, the smaller the bead diameter, the smaller its average
crosslink density.
The large strain properties of some spongy cryogels can also be investigated by
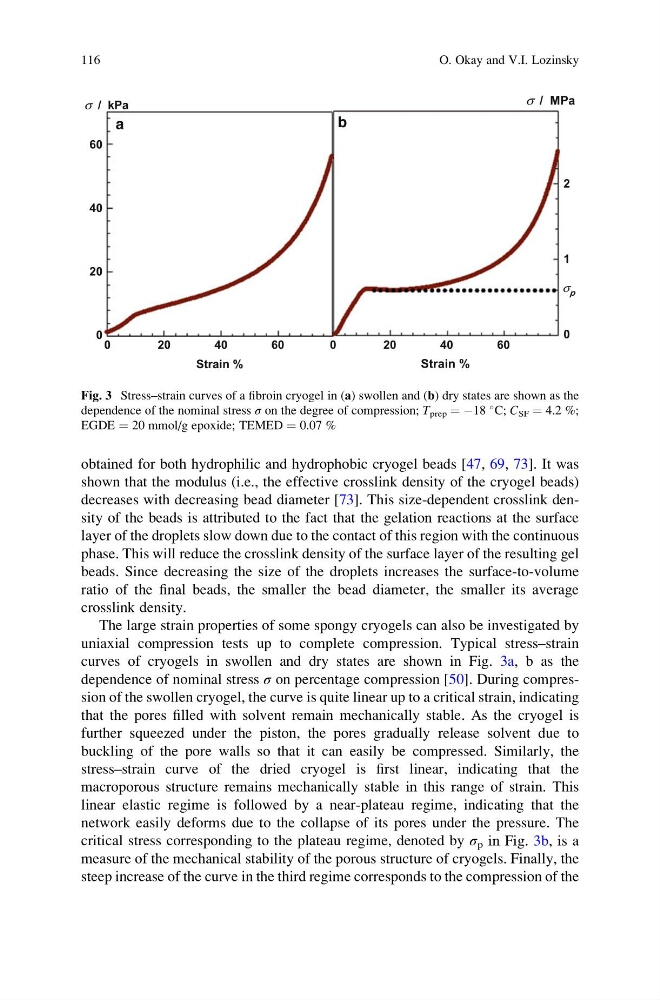
uniaxial compression tests up to complete compression. Typical stress–strain
curves of cryogels in swollen and dry states are shown in Fig. 3a, b as the
dependence of nominal stress σ on percentage compression [50]. During compression of the swollen cryogel, the curve is quite linear up to a critical strain, indicating
that the pores filled with solvent remain mechanically stable. As the cryogel is
further squeezed under the piston, the pores gradually release solvent due to
buckling of the pore walls so that it can easily be compressed. Similarly, the
stress–strain curve of the dried cryogel is first linear, indicating that the
macroporous structure remains mechanically stable in this range of strain. This
linear elastic regime is followed by a near-plateau regime, indicating that the
network easily deforms due to the collapse of its pores under the pressure. The
critical stress corresponding to the plateau regime, denoted by σ p in Fig. 3b, is a
measure of the mechanical stability of the porous structure of cryogels. Finally, the
steep increase of the curve in the third regime corresponds to the compression of the
Strain %
0
2 0
4 0
6 0
σ / MPa
0
1
2
σ p
Strain %
0
2 0
4 0
6 0
σ / kPa
0
20
40
60
a
b
Fig. 3 Stress–strain curves of a fibroin cryogel in (a) swollen and (b) dry states are shown as the
dependence of the nominal stress σ on the degree of compression; T prep ¼ À18
C; C SF ¼ 4.2 %;
EGDE ¼ 20 mmol/g epoxide; TEMED ¼ 0.07 %
116
O. Okay and V.I. Lozinsky
shown that the modulus (i.e., the effective crosslink density of the cryogel beads)
decreases with decreasing bead diameter [73]. This size-dependent crosslink density of the beads is attributed to the fact that the gelation reactions at the surface
layer of the droplets slow down due to the contact of this region with the continuous
phase. This will reduce the crosslink density of the surface layer of the resulting gel
beads. Since decreasing the size of the droplets increases the surface-to-volume
ratio of the final beads, the smaller the bead diameter, the smaller its average
crosslink density.
The large strain properties of some spongy cryogels can also be investigated by
uniaxial compression tests up to complete compression. Typical stress–strain
curves of cryogels in swollen and dry states are shown in Fig. 3a, b as the
dependence of nominal stress σ on percentage compression [50]. During compression of the swollen cryogel, the curve is quite linear up to a critical strain, indicating
that the pores filled with solvent remain mechanically stable. As the cryogel is
further squeezed under the piston, the pores gradually release solvent due to
buckling of the pore walls so that it can easily be compressed. Similarly, the
stress–strain curve of the dried cryogel is first linear, indicating that the
macroporous structure remains mechanically stable in this range of strain. This
linear elastic regime is followed by a near-plateau regime, indicating that the
network easily deforms due to the collapse of its pores under the pressure. The
critical stress corresponding to the plateau regime, denoted by σ p in Fig. 3b, is a
measure of the mechanical stability of the porous structure of cryogels. Finally, the
steep increase of the curve in the third regime corresponds to the compression of the
Strain %
0
2 0
4 0
6 0
σ / MPa
0
1
2
σ p
Strain %
0
2 0
4 0
6 0
σ / kPa
0
20
40
60
a
b
Fig. 3 Stress–strain curves of a fibroin cryogel in (a) swollen and (b) dry states are shown as the
dependence of the nominal stress σ on the degree of compression; T prep ¼ À18
C; C SF ¼ 4.2 %;
EGDE ¼ 20 mmol/g epoxide; TEMED ¼ 0.07 %
116
O. Okay and V.I. Lozinsky