

A typical time for micellization was found to be given by:
τ mic $ exp F a ðϕ 1 Þ
ð
Þ
(48)
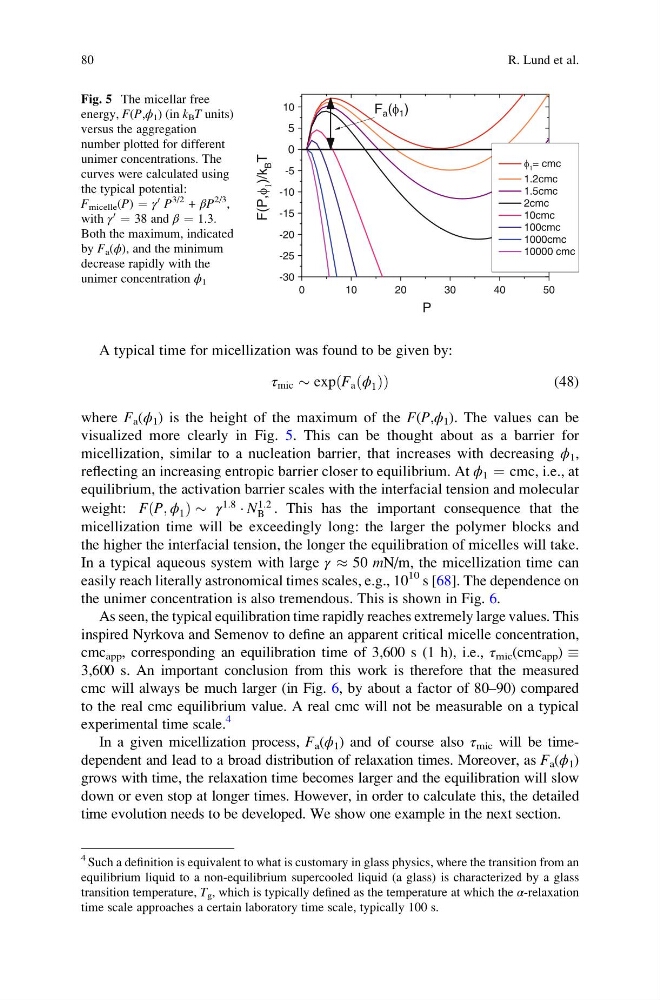
where F a (ϕ 1 ) is the height of the maximum of the F(P,ϕ 1 ). The values can be
visualized more clearly in Fig. 5. This can be thought about as a barrier for
micellization, similar to a nucleation barrier, that increases with decreasing ϕ 1 ,
reflecting an increasing entropic barrier closer to equilibrium. At ϕ 1 ¼ cmc, i.e., at
equilibrium, the activation barrier scales with the interfacial tension and molecular
weight: FðP; ϕ 1 Þ $ γ
1:8
Á N
1:2
B . This has the important consequence that the
micellization time will be exceedingly long: the larger the polymer blocks and
the higher the interfacial tension, the longer the equilibration of micelles will take.
In a typical aqueous system with large γ % 50 mN/m, the micellization time can
easily reach literally astronomical times scales, e.g., 10
10 s [68]. The dependence on
the unimer concentration is also tremendous. This is shown in Fig. 6.
As seen, the typical equilibration time rapidly reaches extremely large values. This
inspired Nyrkova and Semenov to define an apparent critical micelle concentration,
cmc app , corresponding an equilibration time of 3,600 s (1 h), i.e., τ mic (cmc app )
3,600 s. An important conclusion from this work is therefore that the measured
cmc will always be much larger (in Fig. 6, by about a factor of 80–90) compared
to the real cmc equilibrium value. A real cmc will not be measurable on a typical
experimental time scale.
4
In a given micellization process, F a (ϕ 1 ) and of course also τ mic will be timedependent and lead to a broad distribution of relaxation times. Moreover, as F a (ϕ 1 )
grows with time, the relaxation time becomes larger and the equilibration will slow
down or even stop at longer times. However, in order to calculate this, the detailed
time evolution needs to be developed. We show one example in the next section.
0
1 0
2 0
3 0
4 0
5 0
-30
-25
-20
-15
-10
-5
0
5
10
F a (φ 1 )
φ 1 = cmc
1.2cmc
1.5cmc
2cmc
10cmc
100cmc
1000cmc
10000 cmc
F(P,φ
1
)/k
B
T
P
Fig. 5 The micellar free
energy, F(P,ϕ 1 ) (in k B T units)
versus the aggregation
number plotted for different
unimer concentrations. The
curves were calculated using
the typical potential:
F micelle (P) ¼ γ
0 P
3/2 + βP
2/3 ,
with γ
0 ¼ 38 and β ¼ 1.3.
Both the maximum, indicated
by F a (ϕ), and the minimum
decrease rapidly with the
unimer concentration ϕ 1
4 Such a definition is equivalent to what is customary in glass physics, where the transition from an
equilibrium liquid to a non-equilibrium supercooled liquid (a glass) is characterized by a glass
transition temperature, T g , which is typically defined as the temperature at which the α-relaxation
time scale approaches a certain laboratory time scale, typically 100 s.
80
R. Lund et al.
τ mic $ exp F a ðϕ 1 Þ
ð
Þ
(48)
where F a (ϕ 1 ) is the height of the maximum of the F(P,ϕ 1 ). The values can be
visualized more clearly in Fig. 5. This can be thought about as a barrier for
micellization, similar to a nucleation barrier, that increases with decreasing ϕ 1 ,
reflecting an increasing entropic barrier closer to equilibrium. At ϕ 1 ¼ cmc, i.e., at
equilibrium, the activation barrier scales with the interfacial tension and molecular
weight: FðP; ϕ 1 Þ $ γ
1:8
Á N
1:2
B . This has the important consequence that the
micellization time will be exceedingly long: the larger the polymer blocks and
the higher the interfacial tension, the longer the equilibration of micelles will take.
In a typical aqueous system with large γ % 50 mN/m, the micellization time can
easily reach literally astronomical times scales, e.g., 10
10 s [68]. The dependence on
the unimer concentration is also tremendous. This is shown in Fig. 6.
As seen, the typical equilibration time rapidly reaches extremely large values. This
inspired Nyrkova and Semenov to define an apparent critical micelle concentration,
cmc app , corresponding an equilibration time of 3,600 s (1 h), i.e., τ mic (cmc app )
3,600 s. An important conclusion from this work is therefore that the measured
cmc will always be much larger (in Fig. 6, by about a factor of 80–90) compared
to the real cmc equilibrium value. A real cmc will not be measurable on a typical
experimental time scale.
4
In a given micellization process, F a (ϕ 1 ) and of course also τ mic will be timedependent and lead to a broad distribution of relaxation times. Moreover, as F a (ϕ 1 )
grows with time, the relaxation time becomes larger and the equilibration will slow
down or even stop at longer times. However, in order to calculate this, the detailed
time evolution needs to be developed. We show one example in the next section.
0
1 0
2 0
3 0
4 0
5 0
-30
-25
-20
-15
-10
-5
0
5
10
F a (φ 1 )
φ 1 = cmc
1.2cmc
1.5cmc
2cmc
10cmc
100cmc
1000cmc
10000 cmc
F(P,φ
1
)/k
B
T
P
Fig. 5 The micellar free
energy, F(P,ϕ 1 ) (in k B T units)
versus the aggregation
number plotted for different
unimer concentrations. The
curves were calculated using
the typical potential:
F micelle (P) ¼ γ
0 P
3/2 + βP
2/3 ,
with γ
0 ¼ 38 and β ¼ 1.3.
Both the maximum, indicated
by F a (ϕ), and the minimum
decrease rapidly with the
unimer concentration ϕ 1
4 Such a definition is equivalent to what is customary in glass physics, where the transition from an
equilibrium liquid to a non-equilibrium supercooled liquid (a glass) is characterized by a glass
transition temperature, T g , which is typically defined as the temperature at which the α-relaxation
time scale approaches a certain laboratory time scale, typically 100 s.
80
R. Lund et al.