

detected readily through variations in the light-emitting characteristics of the
polymer NWs with high signal amplification when the appropriate receptors are
linked to the surfaces of the NWs. The light-emitting P3MT material is a promising
system to study dopant-mediated DNA detection in fluorescence chain reactionenhanced PL because of the formation of doping-induced bipolaron (i.e., cationic)
states.
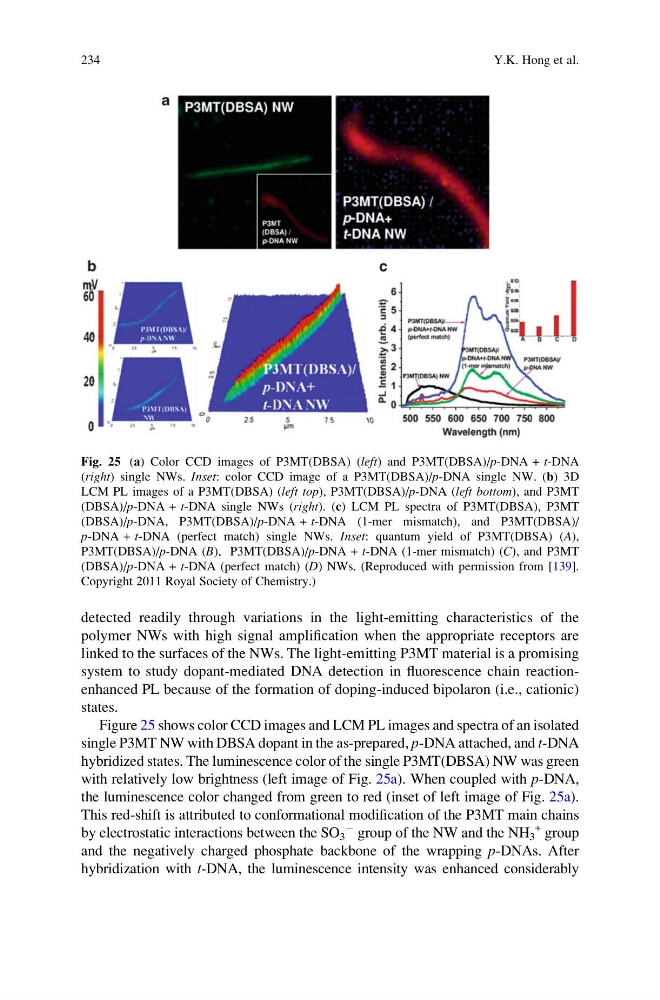
Figure 25 shows color CCD images and LCM PL images and spectra of an isolated
single P3MT NW with DBSA dopant in the as-prepared, p-DNA attached, and t-DNA
hybridized states. The luminescence color of the single P3MT(DBSA) NW was green
with relatively low brightness (left image of Fig. 25a). When coupled with p-DNA,
the luminescence color changed from green to red (inset of left image of Fig. 25a).
This red-shift is attributed to conformational modification of the P3MT main chains
by electrostatic interactions between the SO 3
À group of the NW and the NH 3
+ group
and the negatively charged phosphate backbone of the wrapping p-DNAs. After
hybridization with t-DNA, the luminescence intensity was enhanced considerably
Fig. 25 (a) Color CCD images of P3MT(DBSA) (left) and P3MT(DBSA)/p-DNA + t-DNA
(right) single NWs. Inset: color CCD image of a P3MT(DBSA)/p-DNA single NW. (b) 3D
LCM PL images of a P3MT(DBSA) (left top), P3MT(DBSA)/p-DNA (left bottom), and P3MT
(DBSA)/p-DNA + t-DNA single NWs (right). (c) LCM PL spectra of P3MT(DBSA), P3MT
(DBSA)/p-DNA, P3MT(DBSA)/p-DNA + t-DNA (1-mer mismatch), and P3MT(DBSA)/
p-DNA + t-DNA (perfect match) single NWs. Inset: quantum yield of P3MT(DBSA) (A),
P3MT(DBSA)/p-DNA (B), P3MT(DBSA)/p-DNA + t-DNA (1-mer mismatch) (C), and P3MT
(DBSA)/p-DNA + t-DNA (perfect match) (D) NWs. (Reproduced with permission from [139].
Copyright 2011 Royal Society of Chemistry.)
234
Y.K. Hong et al.
polymer NWs with high signal amplification when the appropriate receptors are
linked to the surfaces of the NWs. The light-emitting P3MT material is a promising
system to study dopant-mediated DNA detection in fluorescence chain reactionenhanced PL because of the formation of doping-induced bipolaron (i.e., cationic)
states.
Figure 25 shows color CCD images and LCM PL images and spectra of an isolated
single P3MT NW with DBSA dopant in the as-prepared, p-DNA attached, and t-DNA
hybridized states. The luminescence color of the single P3MT(DBSA) NW was green
with relatively low brightness (left image of Fig. 25a). When coupled with p-DNA,
the luminescence color changed from green to red (inset of left image of Fig. 25a).
This red-shift is attributed to conformational modification of the P3MT main chains
by electrostatic interactions between the SO 3
À group of the NW and the NH 3
+ group
and the negatively charged phosphate backbone of the wrapping p-DNAs. After
hybridization with t-DNA, the luminescence intensity was enhanced considerably
Fig. 25 (a) Color CCD images of P3MT(DBSA) (left) and P3MT(DBSA)/p-DNA + t-DNA
(right) single NWs. Inset: color CCD image of a P3MT(DBSA)/p-DNA single NW. (b) 3D
LCM PL images of a P3MT(DBSA) (left top), P3MT(DBSA)/p-DNA (left bottom), and P3MT
(DBSA)/p-DNA + t-DNA single NWs (right). (c) LCM PL spectra of P3MT(DBSA), P3MT
(DBSA)/p-DNA, P3MT(DBSA)/p-DNA + t-DNA (1-mer mismatch), and P3MT(DBSA)/
p-DNA + t-DNA (perfect match) single NWs. Inset: quantum yield of P3MT(DBSA) (A),
P3MT(DBSA)/p-DNA (B), P3MT(DBSA)/p-DNA + t-DNA (1-mer mismatch) (C), and P3MT
(DBSA)/p-DNA + t-DNA (perfect match) (D) NWs. (Reproduced with permission from [139].
Copyright 2011 Royal Society of Chemistry.)
234
Y.K. Hong et al.