

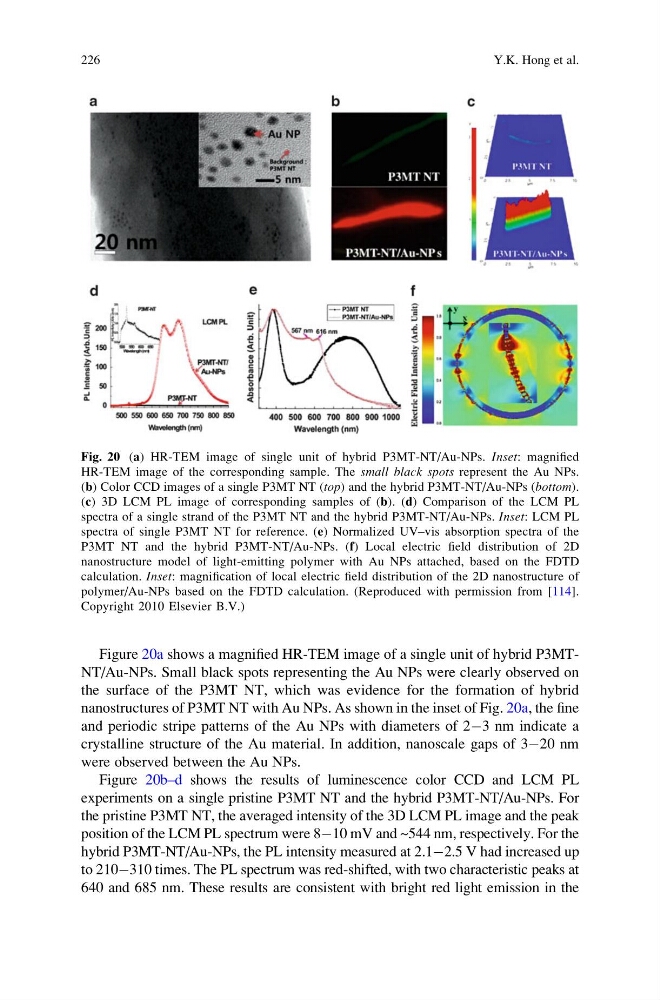
Figure 20a shows a magnified HR-TEM image of a single unit of hybrid P3MTNT/Au-NPs. Small black spots representing the Au NPs were clearly observed on
the surface of the P3MT NT, which was evidence for the formation of hybrid
nanostructures of P3MT NT with Au NPs. As shown in the inset of Fig. 20a, the fine
and periodic stripe patterns of the Au NPs with diameters of 2À3 nm indicate a
crystalline structure of the Au material. In addition, nanoscale gaps of 3À20 nm
were observed between the Au NPs.
Figure 20b–d shows the results of luminescence color CCD and LCM PL
experiments on a single pristine P3MT NT and the hybrid P3MT-NT/Au-NPs. For
the pristine P3MT NT, the averaged intensity of the 3D LCM PL image and the peak
position of the LCM PL spectrum were 8À10 mV and ~544 nm, respectively. For the
hybrid P3MT-NT/Au-NPs, the PL intensity measured at 2.1À2.5 V had increased up
to 210À310 times. The PL spectrum was red-shifted, with two characteristic peaks at
640 and 685 nm. These results are consistent with bright red light emission in the
Fig. 20 (a) HR-TEM image of single unit of hybrid P3MT-NT/Au-NPs. Inset: magnified
HR-TEM image of the corresponding sample. The small black spots represent the Au NPs.
(b) Color CCD images of a single P3MT NT (top) and the hybrid P3MT-NT/Au-NPs (bottom).
(c) 3D LCM PL image of corresponding samples of (b). (d) Comparison of the LCM PL
spectra of a single strand of the P3MT NT and the hybrid P3MT-NT/Au-NPs. Inset: LCM PL
spectra of single P3MT NT for reference. (e) Normalized UV–vis absorption spectra of the
P3MT NT and the hybrid P3MT-NT/Au-NPs. (f) Local electric field distribution of 2D
nanostructure model of light-emitting polymer with Au NPs attached, based on the FDTD
calculation. Inset: magnification of local electric field distribution of the 2D nanostructure of
polymer/Au-NPs based on the FDTD calculation. (Reproduced with permission from [114].
Copyright 2010 Elsevier B.V.)
226
Y.K. Hong et al.
the surface of the P3MT NT, which was evidence for the formation of hybrid
nanostructures of P3MT NT with Au NPs. As shown in the inset of Fig. 20a, the fine
and periodic stripe patterns of the Au NPs with diameters of 2À3 nm indicate a
crystalline structure of the Au material. In addition, nanoscale gaps of 3À20 nm
were observed between the Au NPs.
Figure 20b–d shows the results of luminescence color CCD and LCM PL
experiments on a single pristine P3MT NT and the hybrid P3MT-NT/Au-NPs. For
the pristine P3MT NT, the averaged intensity of the 3D LCM PL image and the peak
position of the LCM PL spectrum were 8À10 mV and ~544 nm, respectively. For the
hybrid P3MT-NT/Au-NPs, the PL intensity measured at 2.1À2.5 V had increased up
to 210À310 times. The PL spectrum was red-shifted, with two characteristic peaks at
640 and 685 nm. These results are consistent with bright red light emission in the
Fig. 20 (a) HR-TEM image of single unit of hybrid P3MT-NT/Au-NPs. Inset: magnified
HR-TEM image of the corresponding sample. The small black spots represent the Au NPs.
(b) Color CCD images of a single P3MT NT (top) and the hybrid P3MT-NT/Au-NPs (bottom).
(c) 3D LCM PL image of corresponding samples of (b). (d) Comparison of the LCM PL
spectra of a single strand of the P3MT NT and the hybrid P3MT-NT/Au-NPs. Inset: LCM PL
spectra of single P3MT NT for reference. (e) Normalized UV–vis absorption spectra of the
P3MT NT and the hybrid P3MT-NT/Au-NPs. (f) Local electric field distribution of 2D
nanostructure model of light-emitting polymer with Au NPs attached, based on the FDTD
calculation. Inset: magnification of local electric field distribution of the 2D nanostructure of
polymer/Au-NPs based on the FDTD calculation. (Reproduced with permission from [114].
Copyright 2010 Elsevier B.V.)
226
Y.K. Hong et al.