

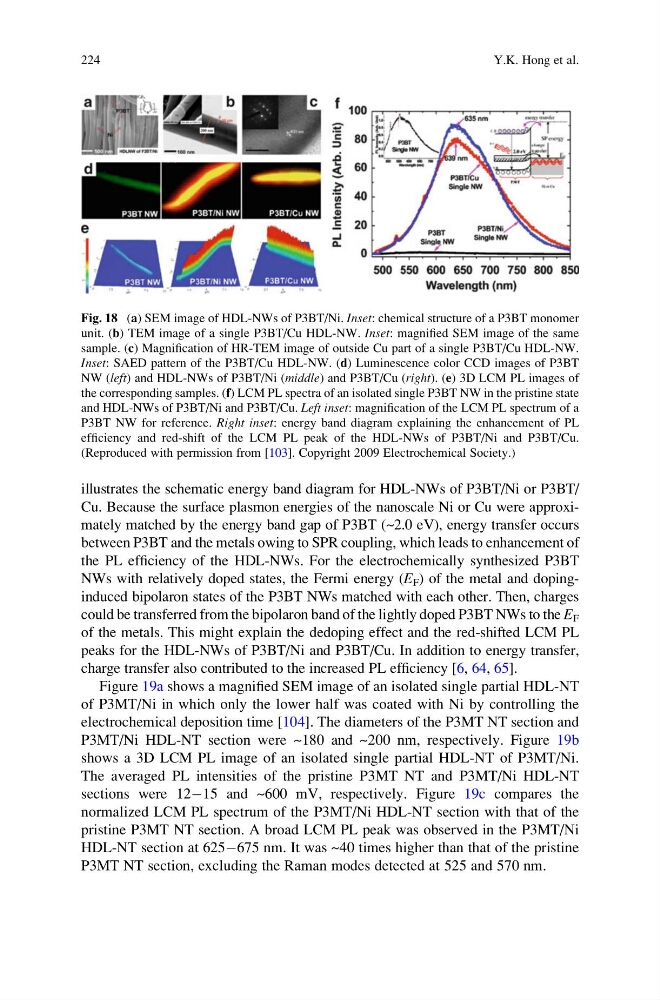
illustrates the schematic energy band diagram for HDL-NWs of P3BT/Ni or P3BT/
Cu. Because the surface plasmon energies of the nanoscale Ni or Cu were approximately matched by the energy band gap of P3BT (~2.0 eV), energy transfer occurs
between P3BT and the metals owing to SPR coupling, which leads to enhancement of
the PL efficiency of the HDL-NWs. For the electrochemically synthesized P3BT
NWs with relatively doped states, the Fermi energy (E F ) of the metal and dopinginduced bipolaron states of the P3BT NWs matched with each other. Then, charges
could be transferred from the bipolaron band of the lightly doped P3BT NWs to the E F
of the metals. This might explain the dedoping effect and the red-shifted LCM PL
peaks for the HDL-NWs of P3BT/Ni and P3BT/Cu. In addition to energy transfer,
charge transfer also contributed to the increased PL efficiency [6, 64, 65].
Figure 19a shows a magnified SEM image of an isolated single partial HDL-NT
of P3MT/Ni in which only the lower half was coated with Ni by controlling the
electrochemical deposition time [104]. The diameters of the P3MT NT section and
P3MT/Ni HDL-NT section were ~180 and ~200 nm, respectively. Figure 19b
shows a 3D LCM PL image of an isolated single partial HDL-NT of P3MT/Ni.
The averaged PL intensities of the pristine P3MT NT and P3MT/Ni HDL-NT
sections were 12À15 and ~600 mV, respectively. Figure 19c compares the
normalized LCM PL spectrum of the P3MT/Ni HDL-NT section with that of the
pristine P3MT NT section. A broad LCM PL peak was observed in the P3MT/Ni
HDL-NT section at 625À675 nm. It was ~40 times higher than that of the pristine
P3MT NT section, excluding the Raman modes detected at 525 and 570 nm.
Fig. 18 (a) SEM image of HDL-NWs of P3BT/Ni. Inset: chemical structure of a P3BT monomer
unit. (b) TEM image of a single P3BT/Cu HDL-NW. Inset: magnified SEM image of the same
sample. (c) Magnification of HR-TEM image of outside Cu part of a single P3BT/Cu HDL-NW.
Inset: SAED pattern of the P3BT/Cu HDL-NW. (d) Luminescence color CCD images of P3BT
NW (left) and HDL-NWs of P3BT/Ni (middle) and P3BT/Cu (right). (e) 3D LCM PL images of
the corresponding samples. (f) LCM PL spectra of an isolated single P3BT NW in the pristine state
and HDL-NWs of P3BT/Ni and P3BT/Cu. Left inset: magnification of the LCM PL spectrum of a
P3BT NW for reference. Right inset: energy band diagram explaining the enhancement of PL
efficiency and red-shift of the LCM PL peak of the HDL-NWs of P3BT/Ni and P3BT/Cu.
(Reproduced with permission from [103]. Copyright 2009 Electrochemical Society.)
224
Y.K. Hong et al.
Cu. Because the surface plasmon energies of the nanoscale Ni or Cu were approximately matched by the energy band gap of P3BT (~2.0 eV), energy transfer occurs
between P3BT and the metals owing to SPR coupling, which leads to enhancement of
the PL efficiency of the HDL-NWs. For the electrochemically synthesized P3BT
NWs with relatively doped states, the Fermi energy (E F ) of the metal and dopinginduced bipolaron states of the P3BT NWs matched with each other. Then, charges
could be transferred from the bipolaron band of the lightly doped P3BT NWs to the E F
of the metals. This might explain the dedoping effect and the red-shifted LCM PL
peaks for the HDL-NWs of P3BT/Ni and P3BT/Cu. In addition to energy transfer,
charge transfer also contributed to the increased PL efficiency [6, 64, 65].
Figure 19a shows a magnified SEM image of an isolated single partial HDL-NT
of P3MT/Ni in which only the lower half was coated with Ni by controlling the
electrochemical deposition time [104]. The diameters of the P3MT NT section and
P3MT/Ni HDL-NT section were ~180 and ~200 nm, respectively. Figure 19b
shows a 3D LCM PL image of an isolated single partial HDL-NT of P3MT/Ni.
The averaged PL intensities of the pristine P3MT NT and P3MT/Ni HDL-NT
sections were 12À15 and ~600 mV, respectively. Figure 19c compares the
normalized LCM PL spectrum of the P3MT/Ni HDL-NT section with that of the
pristine P3MT NT section. A broad LCM PL peak was observed in the P3MT/Ni
HDL-NT section at 625À675 nm. It was ~40 times higher than that of the pristine
P3MT NT section, excluding the Raman modes detected at 525 and 570 nm.
Fig. 18 (a) SEM image of HDL-NWs of P3BT/Ni. Inset: chemical structure of a P3BT monomer
unit. (b) TEM image of a single P3BT/Cu HDL-NW. Inset: magnified SEM image of the same
sample. (c) Magnification of HR-TEM image of outside Cu part of a single P3BT/Cu HDL-NW.
Inset: SAED pattern of the P3BT/Cu HDL-NW. (d) Luminescence color CCD images of P3BT
NW (left) and HDL-NWs of P3BT/Ni (middle) and P3BT/Cu (right). (e) 3D LCM PL images of
the corresponding samples. (f) LCM PL spectra of an isolated single P3BT NW in the pristine state
and HDL-NWs of P3BT/Ni and P3BT/Cu. Left inset: magnification of the LCM PL spectrum of a
P3BT NW for reference. Right inset: energy band diagram explaining the enhancement of PL
efficiency and red-shift of the LCM PL peak of the HDL-NWs of P3BT/Ni and P3BT/Cu.
(Reproduced with permission from [103]. Copyright 2009 Electrochemical Society.)
224
Y.K. Hong et al.