

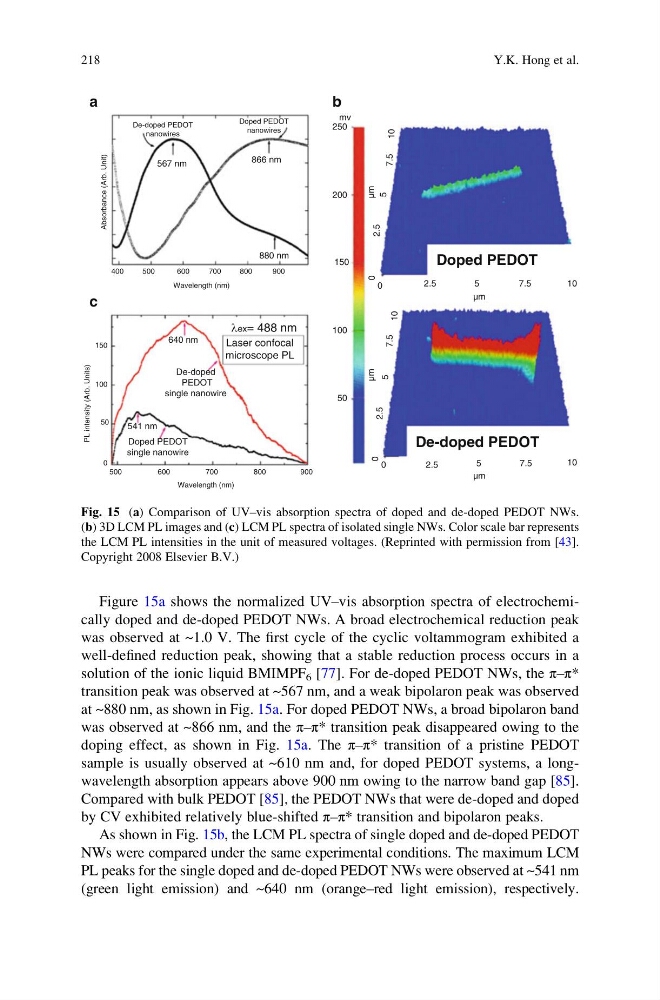
Figure 15a shows the normalized UV–vis absorption spectra of electrochemically doped and de-doped PEDOT NWs. A broad electrochemical reduction peak
was observed at ~1.0 V. The first cycle of the cyclic voltammogram exhibited a
well-defined reduction peak, showing that a stable reduction process occurs in a
solution of the ionic liquid BMIMPF 6 [77]. For de-doped PEDOT NWs, the π–π*
transition peak was observed at ~567 nm, and a weak bipolaron peak was observed
at ~880 nm, as shown in Fig. 15a. For doped PEDOT NWs, a broad bipolaron band
was observed at ~866 nm, and the π–π* transition peak disappeared owing to the
doping effect, as shown in Fig. 15a. The π–π* transition of a pristine PEDOT
sample is usually observed at ~610 nm and, for doped PEDOT systems, a longwavelength absorption appears above 900 nm owing to the narrow band gap [85].
Compared with bulk PEDOT [85], the PEDOT NWs that were de-doped and doped
by CV exhibited relatively blue-shifted π–π* transition and bipolaron peaks.
As shown in Fig. 15b, the LCM PL spectra of single doped and de-doped PEDOT
NWs were compared under the same experimental conditions. The maximum LCM
PL peaks for the single doped and de-doped PEDOT NWs were observed at ~541 nm
(green light emission) and ~640 nm (orange–red light emission), respectively.
Wavelength (nm)
900
Doped PEDOT
nanowires
De-doped PEDOT
nanowires
567 nm
866 nm
880 nm
800
700
600
Absorbance (Arb. Unit)
500
150
PL intensity (Arb. Units)
0
Laser confocal
microscope PL
De-doped
PEDOT
single nanowire
Doped PEDOT
single nanowire
541 nm
Wavelength (nm)
900
50
10
10
7.5
7.5
5
5
Doped PEDOT
De-doped PEDOT
2.5
2.5
0
0
mv
10
10
µm
µm
µm
µm
7.5
7.5
5
5
2.5
2.5
0
0
250
200
150
100
800
700
640 nm
λex= 488 nm
600
500
50
100
400
b
a
c
Fig. 15 (a) Comparison of UV–vis absorption spectra of doped and de-doped PEDOT NWs.
(b) 3D LCM PL images and (c) LCM PL spectra of isolated single NWs. Color scale bar represents
the LCM PL intensities in the unit of measured voltages. (Reprinted with permission from [43].
Copyright 2008 Elsevier B.V.)
218
Y.K. Hong et al.
was observed at ~1.0 V. The first cycle of the cyclic voltammogram exhibited a
well-defined reduction peak, showing that a stable reduction process occurs in a
solution of the ionic liquid BMIMPF 6 [77]. For de-doped PEDOT NWs, the π–π*
transition peak was observed at ~567 nm, and a weak bipolaron peak was observed
at ~880 nm, as shown in Fig. 15a. For doped PEDOT NWs, a broad bipolaron band
was observed at ~866 nm, and the π–π* transition peak disappeared owing to the
doping effect, as shown in Fig. 15a. The π–π* transition of a pristine PEDOT
sample is usually observed at ~610 nm and, for doped PEDOT systems, a longwavelength absorption appears above 900 nm owing to the narrow band gap [85].
Compared with bulk PEDOT [85], the PEDOT NWs that were de-doped and doped
by CV exhibited relatively blue-shifted π–π* transition and bipolaron peaks.
As shown in Fig. 15b, the LCM PL spectra of single doped and de-doped PEDOT
NWs were compared under the same experimental conditions. The maximum LCM
PL peaks for the single doped and de-doped PEDOT NWs were observed at ~541 nm
(green light emission) and ~640 nm (orange–red light emission), respectively.
Wavelength (nm)
900
Doped PEDOT
nanowires
De-doped PEDOT
nanowires
567 nm
866 nm
880 nm
800
700
600
Absorbance (Arb. Unit)
500
150
PL intensity (Arb. Units)
0
Laser confocal
microscope PL
De-doped
PEDOT
single nanowire
Doped PEDOT
single nanowire
541 nm
Wavelength (nm)
900
50
10
10
7.5
7.5
5
5
Doped PEDOT
De-doped PEDOT
2.5
2.5
0
0
mv
10
10
µm
µm
µm
µm
7.5
7.5
5
5
2.5
2.5
0
0
250
200
150
100
800
700
640 nm
λex= 488 nm
600
500
50
100
400
b
a
c
Fig. 15 (a) Comparison of UV–vis absorption spectra of doped and de-doped PEDOT NWs.
(b) 3D LCM PL images and (c) LCM PL spectra of isolated single NWs. Color scale bar represents
the LCM PL intensities in the unit of measured voltages. (Reprinted with permission from [43].
Copyright 2008 Elsevier B.V.)
218
Y.K. Hong et al.