

a
b
0.01
0.02
0.03
0
10
20
30
40
50
60
70
80
90
100
14.5 ms
24.5 ms
194.5 ms
994.5 ms
2914.5 ms
240 s
Unimer Reservoir
Model fits
d /d / (Q) [cm
-1
]
Q [Å
-1 ]
10
15
20
25
30
140
145
150
155
160
165
170
175
180
R
corona
(Å)
P mean
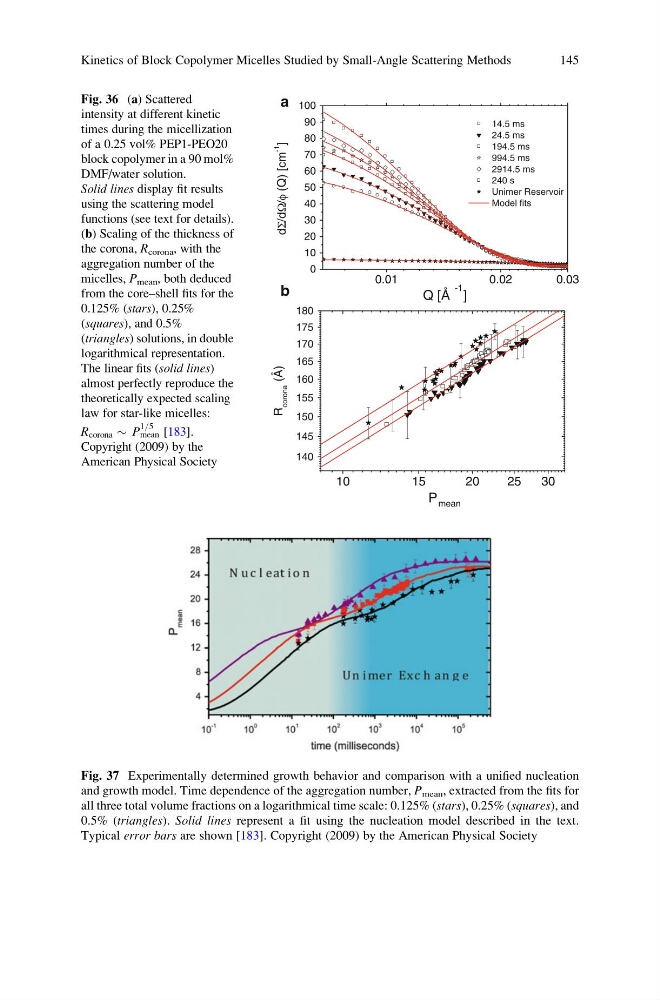
Fig. 36 (a) Scattered
intensity at different kinetic
times during the micellization
of a 0.25 vol% PEP1-PEO20
block copolymer in a 90 mol%
DMF/water solution.
Solid lines display fit results
using the scattering model
functions (see text for details).
(b) Scaling of the thickness of
the corona, R corona , with the
aggregation number of the
micelles, P mean , both deduced
from the core–shell fits for the
0.125% (stars), 0.25%
(squares), and 0.5%
(triangles) solutions, in double
logarithmical representation.
The linear fits (solid lines)
almost perfectly reproduce the
theoretically expected scaling
law for star-like micelles:
R corona $ P
1=5
mean [183].
Copyright (2009) by the
American Physical Society
Fig. 37 Experimentally determined growth behavior and comparison with a unified nucleation
and growth model. Time dependence of the aggregation number, P mean , extracted from the fits for
all three total volume fractions on a logarithmical time scale: 0.125% (stars), 0.25% (squares), and
0.5% (triangles). Solid lines represent a fit using the nucleation model described in the text.
Typical error bars are shown [183]. Copyright (2009) by the American Physical Society
Kinetics of Block Copolymer Micelles Studied by Small-Angle Scattering Methods
145
b
0.01
0.02
0.03
0
10
20
30
40
50
60
70
80
90
100
14.5 ms
24.5 ms
194.5 ms
994.5 ms
2914.5 ms
240 s
Unimer Reservoir
Model fits
d /d / (Q) [cm
-1
]
Q [Å
-1 ]
10
15
20
25
30
140
145
150
155
160
165
170
175
180
R
corona
(Å)
P mean
Fig. 36 (a) Scattered
intensity at different kinetic
times during the micellization
of a 0.25 vol% PEP1-PEO20
block copolymer in a 90 mol%
DMF/water solution.
Solid lines display fit results
using the scattering model
functions (see text for details).
(b) Scaling of the thickness of
the corona, R corona , with the
aggregation number of the
micelles, P mean , both deduced
from the core–shell fits for the
0.125% (stars), 0.25%
(squares), and 0.5%
(triangles) solutions, in double
logarithmical representation.
The linear fits (solid lines)
almost perfectly reproduce the
theoretically expected scaling
law for star-like micelles:
R corona $ P
1=5
mean [183].
Copyright (2009) by the
American Physical Society
Fig. 37 Experimentally determined growth behavior and comparison with a unified nucleation
and growth model. Time dependence of the aggregation number, P mean , extracted from the fits for
all three total volume fractions on a logarithmical time scale: 0.125% (stars), 0.25% (squares), and
0.5% (triangles). Solid lines represent a fit using the nucleation model described in the text.
Typical error bars are shown [183]. Copyright (2009) by the American Physical Society
Kinetics of Block Copolymer Micelles Studied by Small-Angle Scattering Methods
145