

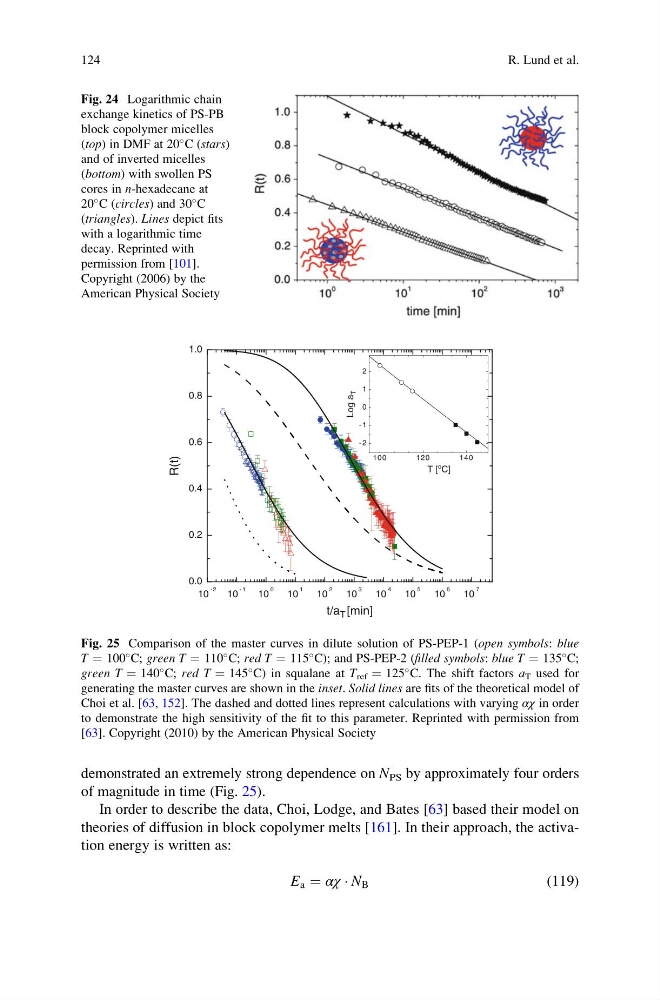
demonstrated an extremely strong dependence on N PS by approximately four orders
of magnitude in time (Fig. 25).
In order to describe the data, Choi, Lodge, and Bates [63] based their model on
theories of diffusion in block copolymer melts [161]. In their approach, the activation energy is written as:
E a ¼ αχ Á N B
(119)
Fig. 24 Logarithmic chain
exchange kinetics of PS-PB
block copolymer micelles
(top) in DMF at 20
C (stars)
and of inverted micelles
(bottom) with swollen PS
cores in n-hexadecane at
20
C (circles) and 30
C
(triangles). Lines depict fits
with a logarithmic time
decay. Reprinted with
permission from [101].
Copyright (2006) by the
American Physical Society
10
-2
10
-1
10
0
10
1
10
2
10
3
10
4
10
5
10
6
10
7
0.0
0.2
0.4
0.6
0.8
1.0
R(t)
t/a T [min]
100
120
140
-2
-1
0
1
2
Log a
T
T [
o
C]
Fig. 25 Comparison of the master curves in dilute solution of PS-PEP-1 (open symbols: blue
T ¼ 100
C; green T ¼ 110
C; red T ¼ 115
C); and PS-PEP-2 (filled symbols: blue T ¼ 135
C;
green T ¼ 140
C; red T ¼ 145
C) in squalane at T ref ¼ 125
C. The shift factors a T used for
generating the master curves are shown in the inset. Solid lines are fits of the theoretical model of
Choi et al. [63, 152]. The dashed and dotted lines represent calculations with varying αχ in order
to demonstrate the high sensitivity of the fit to this parameter. Reprinted with permission from
[63]. Copyright (2010) by the American Physical Society
124
R. Lund et al.
of magnitude in time (Fig. 25).
In order to describe the data, Choi, Lodge, and Bates [63] based their model on
theories of diffusion in block copolymer melts [161]. In their approach, the activation energy is written as:
E a ¼ αχ Á N B
(119)
Fig. 24 Logarithmic chain
exchange kinetics of PS-PB
block copolymer micelles
(top) in DMF at 20
C (stars)
and of inverted micelles
(bottom) with swollen PS
cores in n-hexadecane at
20
C (circles) and 30
C
(triangles). Lines depict fits
with a logarithmic time
decay. Reprinted with
permission from [101].
Copyright (2006) by the
American Physical Society
10
-2
10
-1
10
0
10
1
10
2
10
3
10
4
10
5
10
6
10
7
0.0
0.2
0.4
0.6
0.8
1.0
R(t)
t/a T [min]
100
120
140
-2
-1
0
1
2
Log a
T
T [
o
C]
Fig. 25 Comparison of the master curves in dilute solution of PS-PEP-1 (open symbols: blue
T ¼ 100
C; green T ¼ 110
C; red T ¼ 115
C); and PS-PEP-2 (filled symbols: blue T ¼ 135
C;
green T ¼ 140
C; red T ¼ 145
C) in squalane at T ref ¼ 125
C. The shift factors a T used for
generating the master curves are shown in the inset. Solid lines are fits of the theoretical model of
Choi et al. [63, 152]. The dashed and dotted lines represent calculations with varying αχ in order
to demonstrate the high sensitivity of the fit to this parameter. Reprinted with permission from
[63]. Copyright (2010) by the American Physical Society
124
R. Lund et al.