

Eq. 87. At higher scattering vectors this is not the case because A
2
c 6 ¼ A
2
sh , giving
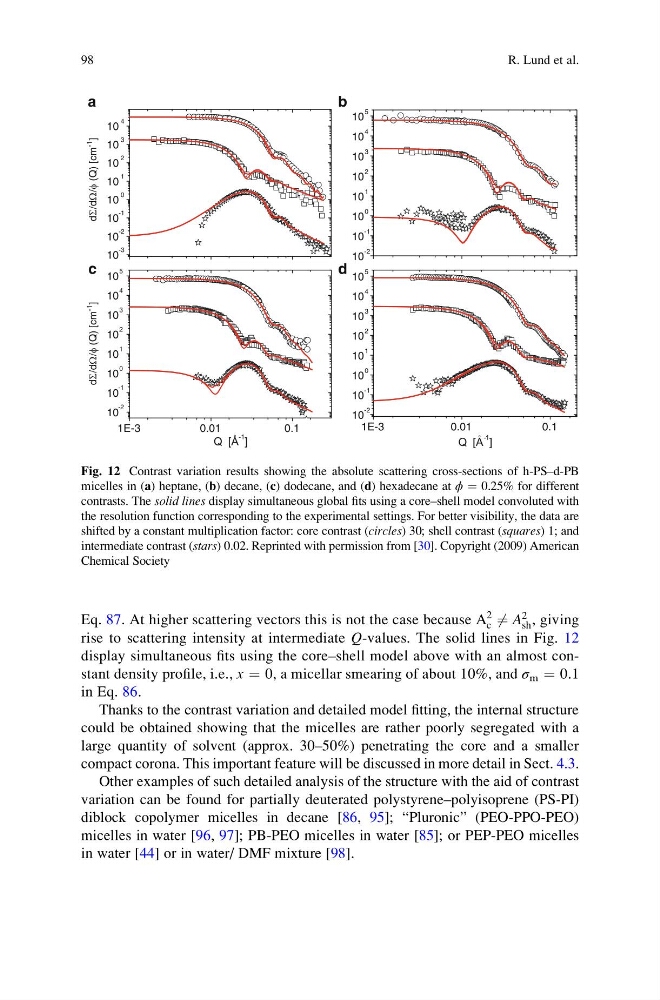
rise to scattering intensity at intermediate Q-values. The solid lines in Fig. 12
display simultaneous fits using the core–shell model above with an almost constant density profile, i.e., x ¼ 0, a micellar smearing of about 10%, and σ m ¼ 0.1
in Eq. 86.
Thanks to the contrast variation and detailed model fitting, the internal structure
could be obtained showing that the micelles are rather poorly segregated with a
large quantity of solvent (approx. 30–50%) penetrating the core and a smaller
compact corona. This important feature will be discussed in more detail in Sect. 4.3.
Other examples of such detailed analysis of the structure with the aid of contrast
variation can be found for partially deuterated polystyrene–polyisoprene (PS-PI)
diblock copolymer micelles in decane [86, 95]; “Pluronic” (PEO-PPO-PEO)
micelles in water [96, 97]; PB-PEO micelles in water [85]; or PEP-PEO micelles
in water [44] or in water/ DMF mixture [98].
10
-3
10
-2
10
-1
10
0
10
1
10
2
10
3
10
4
10
-2
10
-1
10
0
10
1
10
2
10
3
10
4
10
5
1E-3
0.01
0.1
10
-2
10
-1
10
0
10
1
10
2
10
3
10
4
10
5
1E-3
0.01
0.1
10
-2
10
-1
10
0
10
1
10
2
10
3
10
4
10
5
dΣ/dΩ/φ (Q) [cm
-1
]
dΣ/dΩ/φ (Q) [cm
-1
]
a
b
c
d
Fig. 12 Contrast variation results showing the absolute scattering cross-sections of h-PS–d-PB
micelles in (a) heptane, (b) decane, (c) dodecane, and (d) hexadecane at ϕ ¼ 0.25% for different
contrasts. The solid lines display simultaneous global fits using a core–shell model convoluted with
the resolution function corresponding to the experimental settings. For better visibility, the data are
shifted by a constant multiplication factor: core contrast (circles) 30; shell contrast (squares) 1; and
intermediate contrast (stars) 0.02. Reprinted with permission from [30]. Copyright (2009) American
Chemical Society
98
R. Lund et al.
2
c 6 ¼ A
2
sh , giving
rise to scattering intensity at intermediate Q-values. The solid lines in Fig. 12
display simultaneous fits using the core–shell model above with an almost constant density profile, i.e., x ¼ 0, a micellar smearing of about 10%, and σ m ¼ 0.1
in Eq. 86.
Thanks to the contrast variation and detailed model fitting, the internal structure
could be obtained showing that the micelles are rather poorly segregated with a
large quantity of solvent (approx. 30–50%) penetrating the core and a smaller
compact corona. This important feature will be discussed in more detail in Sect. 4.3.
Other examples of such detailed analysis of the structure with the aid of contrast
variation can be found for partially deuterated polystyrene–polyisoprene (PS-PI)
diblock copolymer micelles in decane [86, 95]; “Pluronic” (PEO-PPO-PEO)
micelles in water [96, 97]; PB-PEO micelles in water [85]; or PEP-PEO micelles
in water [44] or in water/ DMF mixture [98].
10
-3
10
-2
10
-1
10
0
10
1
10
2
10
3
10
4
10
-2
10
-1
10
0
10
1
10
2
10
3
10
4
10
5
1E-3
0.01
0.1
10
-2
10
-1
10
0
10
1
10
2
10
3
10
4
10
5
1E-3
0.01
0.1
10
-2
10
-1
10
0
10
1
10
2
10
3
10
4
10
5
dΣ/dΩ/φ (Q) [cm
-1
]
dΣ/dΩ/φ (Q) [cm
-1
]
a
b
c
d
Fig. 12 Contrast variation results showing the absolute scattering cross-sections of h-PS–d-PB
micelles in (a) heptane, (b) decane, (c) dodecane, and (d) hexadecane at ϕ ¼ 0.25% for different
contrasts. The solid lines display simultaneous global fits using a core–shell model convoluted with
the resolution function corresponding to the experimental settings. For better visibility, the data are
shifted by a constant multiplication factor: core contrast (circles) 30; shell contrast (squares) 1; and
intermediate contrast (stars) 0.02. Reprinted with permission from [30]. Copyright (2009) American
Chemical Society
98
R. Lund et al.