

3.1 Approach for Modeling of Fixed-Bed Hybrid Bioreactor
45
substrate mass balance equation developed from both suspended and attached growth,
the suspended biomass concentration can be substituted by the expression derived
from the steady-state mass balance of active micro-organisms in a biofilm as well
as under suspended-growth state. While biomass balance equation is exercised for
hybrid bioreactor, the shear loss of biofilm from the attached growth has been added
to the suspended-growth biomass. Now, the effective biofilm thickness can be determined by applying Runge–Kutta method as a solution of classical mass balance
equation of substrate in the biofilm.
3.2 Approach for the Development of Analytical Procedure
for Determining the Kinetic Coefficients of Hybrid
Bioreactor
In order to determine the kinetic coefficients of hybrid bioreactor, analytical solution
has been done in the following steps:
Step 1
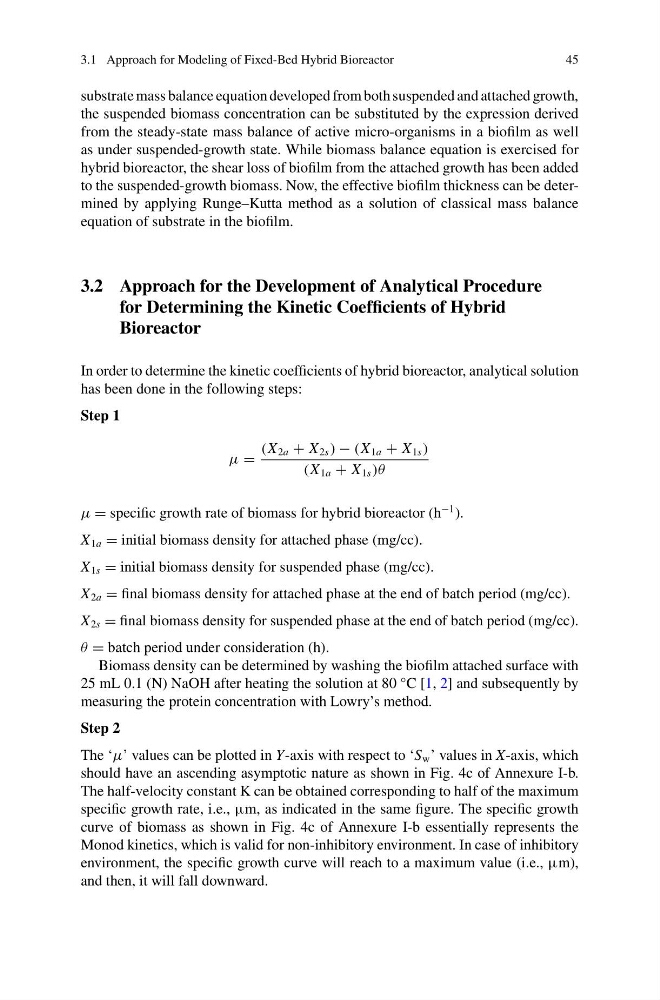
μ =
(X 2a + X 2s ) − (X 1a + X 1s )
(X 1a + X 1s )θ
μ = specific growth rate of biomass for hybrid bioreactor (h
−1 ).
X 1a = initial biomass density for attached phase (mg/cc).
X 1s = initial biomass density for suspended phase (mg/cc).
X 2a = final biomass density for attached phase at the end of batch period (mg/cc).
X 2s = final biomass density for suspended phase at the end of batch period (mg/cc).
θ = batch period under consideration (h).
Biomass density can be determined by washing the biofilm attached surface with
25 mL 0.1 (N) NaOH after heating the solution at 80 °C [1, 2] and subsequently by
measuring the protein concentration with Lowry’s method.
Step 2
The ‘μ’ values can be plotted in Y-axis with respect to ‘S w ’ values in X-axis, which
should have an ascending asymptotic nature as shown in Fig. 4c of Annexure I-b.
The half-velocity constant K can be obtained corresponding to half of the maximum
specific growth rate, i.e., µm, as indicated in the same figure. The specific growth
curve of biomass as shown in Fig. 4c of Annexure I-b essentially represents the
Monod kinetics, which is valid for non-inhibitory environment. In case of inhibitory
environment, the specific growth curve will reach to a maximum value (i.e., µm),
and then, it will fall downward.
45
substrate mass balance equation developed from both suspended and attached growth,
the suspended biomass concentration can be substituted by the expression derived
from the steady-state mass balance of active micro-organisms in a biofilm as well
as under suspended-growth state. While biomass balance equation is exercised for
hybrid bioreactor, the shear loss of biofilm from the attached growth has been added
to the suspended-growth biomass. Now, the effective biofilm thickness can be determined by applying Runge–Kutta method as a solution of classical mass balance
equation of substrate in the biofilm.
3.2 Approach for the Development of Analytical Procedure
for Determining the Kinetic Coefficients of Hybrid
Bioreactor
In order to determine the kinetic coefficients of hybrid bioreactor, analytical solution
has been done in the following steps:
Step 1
μ =
(X 2a + X 2s ) − (X 1a + X 1s )
(X 1a + X 1s )θ
μ = specific growth rate of biomass for hybrid bioreactor (h
−1 ).
X 1a = initial biomass density for attached phase (mg/cc).
X 1s = initial biomass density for suspended phase (mg/cc).
X 2a = final biomass density for attached phase at the end of batch period (mg/cc).
X 2s = final biomass density for suspended phase at the end of batch period (mg/cc).
θ = batch period under consideration (h).
Biomass density can be determined by washing the biofilm attached surface with
25 mL 0.1 (N) NaOH after heating the solution at 80 °C [1, 2] and subsequently by
measuring the protein concentration with Lowry’s method.
Step 2
The ‘μ’ values can be plotted in Y-axis with respect to ‘S w ’ values in X-axis, which
should have an ascending asymptotic nature as shown in Fig. 4c of Annexure I-b.
The half-velocity constant K can be obtained corresponding to half of the maximum
specific growth rate, i.e., µm, as indicated in the same figure. The specific growth
curve of biomass as shown in Fig. 4c of Annexure I-b essentially represents the
Monod kinetics, which is valid for non-inhibitory environment. In case of inhibitory
environment, the specific growth curve will reach to a maximum value (i.e., µm),
and then, it will fall downward.