

110
8 Experimental Validation of the Model Developed …
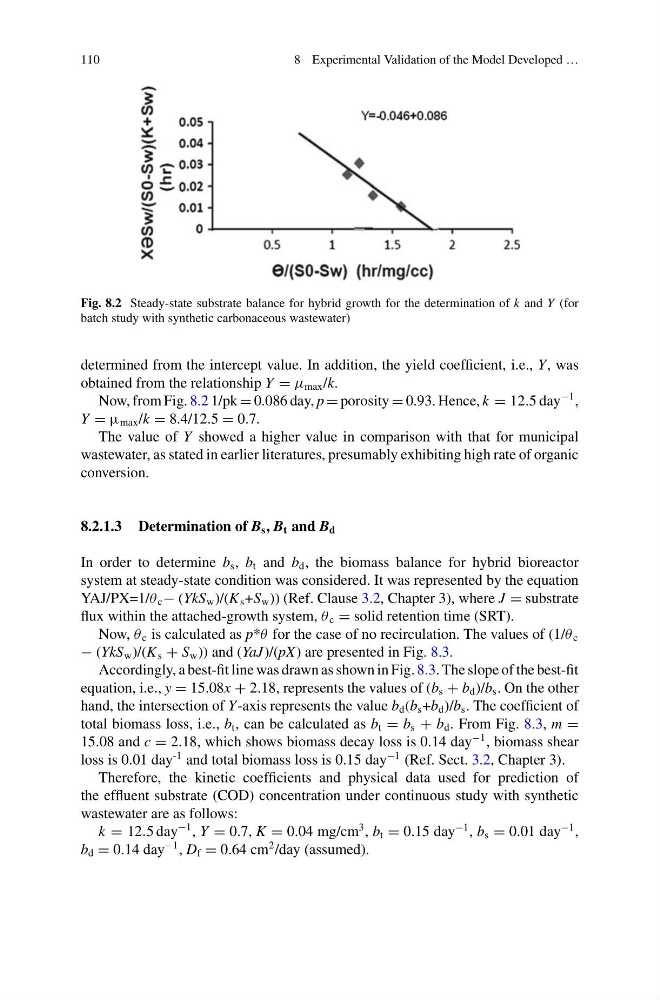
Fig. 8.2 Steady-state substrate balance for hybrid growth for the determination of k and Y (for
batch study with synthetic carbonaceous wastewater)
determined from the intercept value. In addition, the yield coefficient, i.e., Y, was
obtained from the relationship Y = μ max /k.
Now, from Fig. 8.2 1/pk = 0.086 day, p = porosity = 0.93. Hence, k = 12.5 day
−1 ,
Y = μ max /k = 8.4/12.5 = 0.7.
The value of Y showed a higher value in comparison with that for municipal
wastewater, as stated in earlier literatures, presumably exhibiting high rate of organic
conversion.
8.2.1.3 Determination of B s , B t and B d
In order to determine b s , b t and b d , the biomass balance for hybrid bioreactor
system at steady-state condition was considered. It was represented by the equation
YAJ/PX=1/θ c − (YkS w )/(K s +S w )) (Ref. Clause 3.2, Chapter 3), where J = substrate
flux within the attached-growth system, θ c = solid retention time (SRT).
Now, θ c is calculated as p*θ for the case of no recirculation. The values of (1/θ c
− (YkS w )/(K s + S w )) and (YaJ)/(pX) are presented in Fig. 8.3.
Accordingly, a best-fit line was drawn as shown in Fig. 8.3. The slope of the best-fit
equation, i.e., y = 15.08x + 2.18, represents the values of (b s + b d )/b s . On the other
hand, the intersection of Y-axis represents the value b d (b s +b d )/b s . The coefficient of
total biomass loss, i.e., b t , can be calculated as b t = b s + b d . From Fig. 8.3, m =
15.08 and c = 2.18, which shows biomass decay loss is 0.14 day
−1 , biomass shear
loss is 0.01 day
-1 and total biomass loss is 0.15 day
−1 (Ref. Sect. 3.2, Chapter 3).
Therefore, the kinetic coefficients and physical data used for prediction of
the effluent substrate (COD) concentration under continuous study with synthetic
wastewater are as follows:
k = 12.5 day
−1 , Y = 0.7, K = 0.04 mg/cm
3 , b t = 0.15 day
−1 , b s = 0.01 day
−1 ,
b d = 0.14 day
−1 , D f = 0.64 cm
2 /day (assumed).
8 Experimental Validation of the Model Developed …
Fig. 8.2 Steady-state substrate balance for hybrid growth for the determination of k and Y (for
batch study with synthetic carbonaceous wastewater)
determined from the intercept value. In addition, the yield coefficient, i.e., Y, was
obtained from the relationship Y = μ max /k.
Now, from Fig. 8.2 1/pk = 0.086 day, p = porosity = 0.93. Hence, k = 12.5 day
−1 ,
Y = μ max /k = 8.4/12.5 = 0.7.
The value of Y showed a higher value in comparison with that for municipal
wastewater, as stated in earlier literatures, presumably exhibiting high rate of organic
conversion.
8.2.1.3 Determination of B s , B t and B d
In order to determine b s , b t and b d , the biomass balance for hybrid bioreactor
system at steady-state condition was considered. It was represented by the equation
YAJ/PX=1/θ c − (YkS w )/(K s +S w )) (Ref. Clause 3.2, Chapter 3), where J = substrate
flux within the attached-growth system, θ c = solid retention time (SRT).
Now, θ c is calculated as p*θ for the case of no recirculation. The values of (1/θ c
− (YkS w )/(K s + S w )) and (YaJ)/(pX) are presented in Fig. 8.3.
Accordingly, a best-fit line was drawn as shown in Fig. 8.3. The slope of the best-fit
equation, i.e., y = 15.08x + 2.18, represents the values of (b s + b d )/b s . On the other
hand, the intersection of Y-axis represents the value b d (b s +b d )/b s . The coefficient of
total biomass loss, i.e., b t , can be calculated as b t = b s + b d . From Fig. 8.3, m =
15.08 and c = 2.18, which shows biomass decay loss is 0.14 day
−1 , biomass shear
loss is 0.01 day
-1 and total biomass loss is 0.15 day
−1 (Ref. Sect. 3.2, Chapter 3).
Therefore, the kinetic coefficients and physical data used for prediction of
the effluent substrate (COD) concentration under continuous study with synthetic
wastewater are as follows:
k = 12.5 day
−1 , Y = 0.7, K = 0.04 mg/cm
3 , b t = 0.15 day
−1 , b s = 0.01 day
−1 ,
b d = 0.14 day
−1 , D f = 0.64 cm
2 /day (assumed).