

8.2 Methodology for Experimental Validation
109
Table 8.1 Determination of specific growth rate of biomass “μ” in a batch study (for synthetic
carbonaceous wastewater)
Batch period (θ, h)
Biomass
COD (S w , mg/l)
μ
h −1
At first day of batch study
9 a.m.
0
2526
158
11 a.m.
2
4131
90
0.318
1 p.m.
4
4434
45
0.18877791
3 p.m.
6
4476
27
0.12861227
5 p.m.
8
4522
18
0.09873529
At second day of batch study
9 a.m.
0
2627
189
11 a.m.
2
4534
87
0.32872600
1 p.m.
4
4410
41
0.16966900
3 p.m.
6
4489
30
0.11809386
5 p.m.
8
4822
13
0.10442179
At third day of batch study
9 a.m.
0
2120
270
11 a.m.
2
3516
155
0.32921123
1 p.m.
4
3612
59
0.17586828
3 p.m.
6
3707
28
0.12471937
5 p.m.
8
3867
21
0.10298875
0.400
0.350
0.300
0.250
0.200
0.150
0.100
0.050
0.000
0
5 0
1 0 0
1 5 0
2 0 0
COD (mg/l)
µ(hr-1)
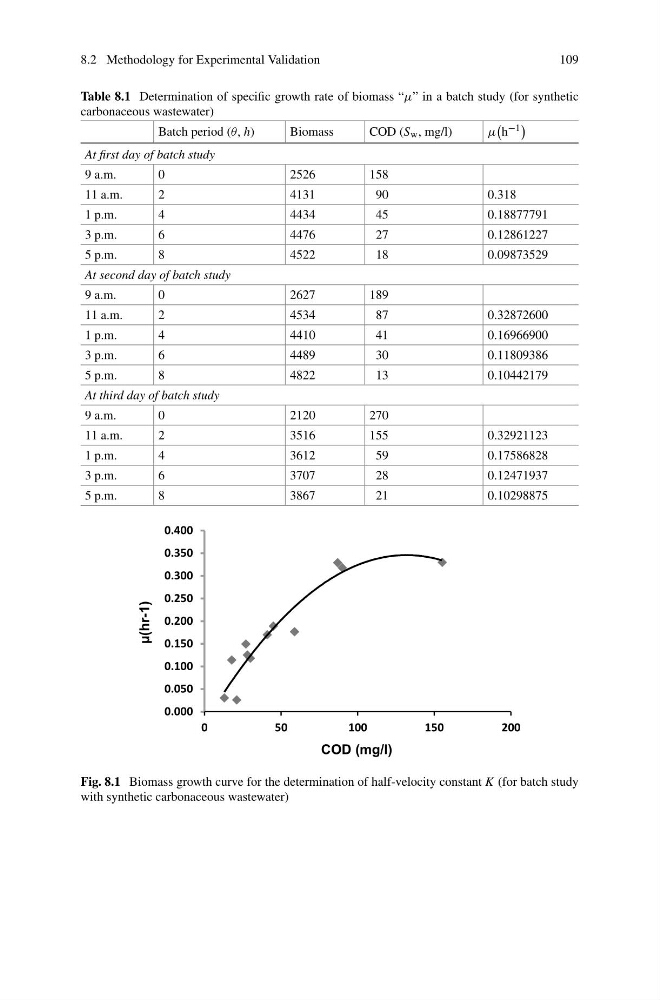
Fig. 8.1 Biomass growth curve for the determination of half-velocity constant K (for batch study
with synthetic carbonaceous wastewater)
109
Table 8.1 Determination of specific growth rate of biomass “μ” in a batch study (for synthetic
carbonaceous wastewater)
Batch period (θ, h)
Biomass
COD (S w , mg/l)
μ
h −1
At first day of batch study
9 a.m.
0
2526
158
11 a.m.
2
4131
90
0.318
1 p.m.
4
4434
45
0.18877791
3 p.m.
6
4476
27
0.12861227
5 p.m.
8
4522
18
0.09873529
At second day of batch study
9 a.m.
0
2627
189
11 a.m.
2
4534
87
0.32872600
1 p.m.
4
4410
41
0.16966900
3 p.m.
6
4489
30
0.11809386
5 p.m.
8
4822
13
0.10442179
At third day of batch study
9 a.m.
0
2120
270
11 a.m.
2
3516
155
0.32921123
1 p.m.
4
3612
59
0.17586828
3 p.m.
6
3707
28
0.12471937
5 p.m.
8
3867
21
0.10298875
0.400
0.350
0.300
0.250
0.200
0.150
0.100
0.050
0.000
0
5 0
1 0 0
1 5 0
2 0 0
COD (mg/l)
µ(hr-1)
Fig. 8.1 Biomass growth curve for the determination of half-velocity constant K (for batch study
with synthetic carbonaceous wastewater)