

78
D. Lahiri et al.
a
b
c
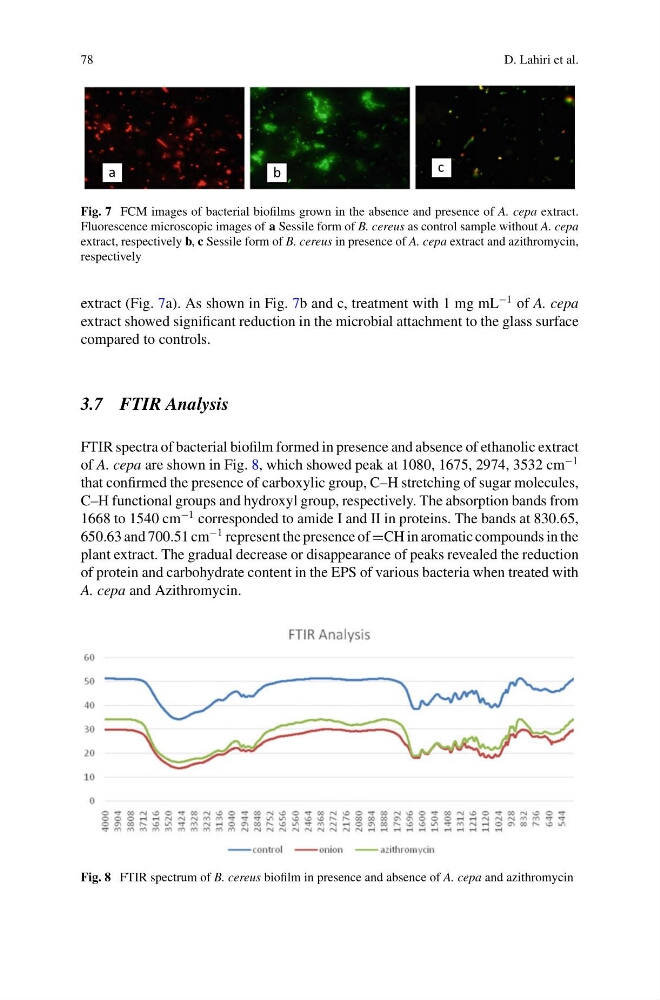
Fig. 7 FCM images of bacterial biofilms grown in the absence and presence of A. cepa extract.
Fluorescence microscopic images of a Sessile form of B. cereus as control sample without A. cepa
extract, respectively b, c Sessile form of B. cereus in presence of A. cepa extract and azithromycin,
respectively
extract (Fig. 7a). As shown in Fig. 7b and c, treatment with 1 mg mL
−1 of A. cepa
extract showed significant reduction in the microbial attachment to the glass surface
compared to controls.
3.7 FTIR Analysis
FTIR spectra of bacterial biofilm formed in presence and absence of ethanolic extract
of A. cepa are shown in Fig. 8, which showed peak at 1080, 1675, 2974, 3532 cm
−1
that confirmed the presence of carboxylic group, C–H stretching of sugar molecules,
C–H functional groups and hydroxyl group, respectively. The absorption bands from
1668 to 1540 cm
−1 corresponded to amide I and II in proteins. The bands at 830.65,
650.63 and 700.51 cm
−1 represent the presence of =CH in aromatic compounds in the
plant extract. The gradual decrease or disappearance of peaks revealed the reduction
of protein and carbohydrate content in the EPS of various bacteria when treated with
A. cepa and Azithromycin.
Fig. 8 FTIR spectrum of B. cereus biofilm in presence and absence of A. cepa and azithromycin
D. Lahiri et al.
a
b
c
Fig. 7 FCM images of bacterial biofilms grown in the absence and presence of A. cepa extract.
Fluorescence microscopic images of a Sessile form of B. cereus as control sample without A. cepa
extract, respectively b, c Sessile form of B. cereus in presence of A. cepa extract and azithromycin,
respectively
extract (Fig. 7a). As shown in Fig. 7b and c, treatment with 1 mg mL
−1 of A. cepa
extract showed significant reduction in the microbial attachment to the glass surface
compared to controls.
3.7 FTIR Analysis
FTIR spectra of bacterial biofilm formed in presence and absence of ethanolic extract
of A. cepa are shown in Fig. 8, which showed peak at 1080, 1675, 2974, 3532 cm
−1
that confirmed the presence of carboxylic group, C–H stretching of sugar molecules,
C–H functional groups and hydroxyl group, respectively. The absorption bands from
1668 to 1540 cm
−1 corresponded to amide I and II in proteins. The bands at 830.65,
650.63 and 700.51 cm
−1 represent the presence of =CH in aromatic compounds in the
plant extract. The gradual decrease or disappearance of peaks revealed the reduction
of protein and carbohydrate content in the EPS of various bacteria when treated with
A. cepa and Azithromycin.
Fig. 8 FTIR spectrum of B. cereus biofilm in presence and absence of A. cepa and azithromycin