

Isolation, Screening, and Evaluation of Cellulase-Producing …
463
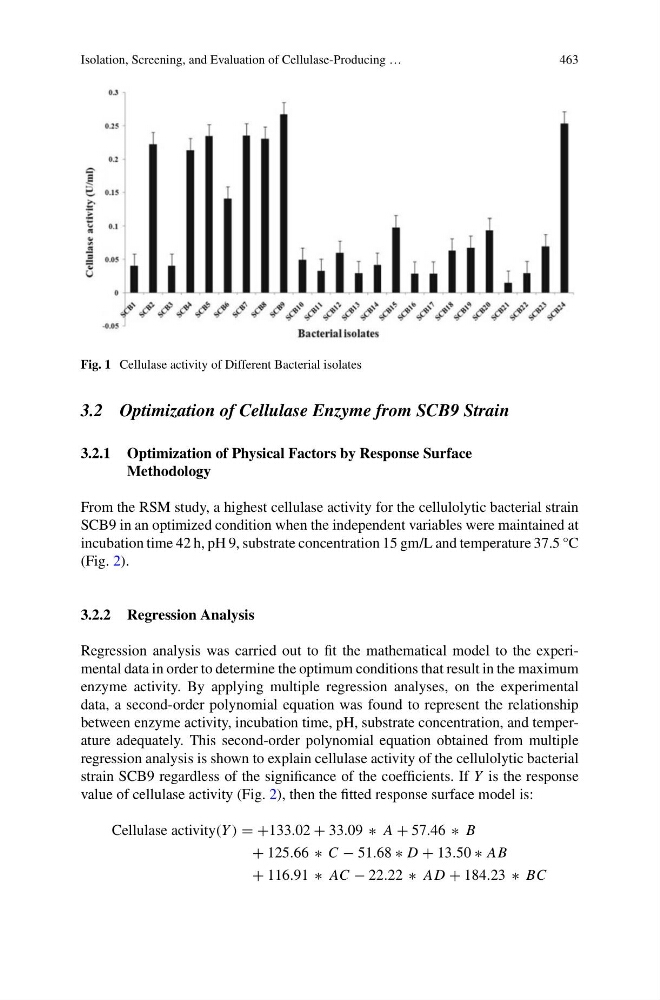
Fig. 1 Cellulase activity of Different Bacterial isolates
3.2 Optimization of Cellulase Enzyme from SCB9 Strain
3.2.1 Optimization of Physical Factors by Response Surface
Methodology
From the RSM study, a highest cellulase activity for the cellulolytic bacterial strain
SCB9 in an optimized condition when the independent variables were maintained at
incubation time 42 h, pH 9, substrate concentration 15 gm/L and temperature 37.5 °C
(Fig. 2).
3.2.2 Regression Analysis
Regression analysis was carried out to fit the mathematical model to the experimental data in order to determine the optimum conditions that result in the maximum
enzyme activity. By applying multiple regression analyses, on the experimental
data, a second-order polynomial equation was found to represent the relationship
between enzyme activity, incubation time, pH, substrate concentration, and temperature adequately. This second-order polynomial equation obtained from multiple
regression analysis is shown to explain cellulase activity of the cellulolytic bacterial
strain SCB9 regardless of the significance of the coefficients. If Y is the response
value of cellulase activity (Fig. 2), then the fitted response surface model is:
Cellulase activity(Y ) = +133.02 + 33.09 ∗ A + 57.46 ∗ B
+ 125.66 ∗ C − 51.68 ∗ D + 13.50 ∗ AB
+ 116.91 ∗ AC − 22.22 ∗ AD + 184.23 ∗ BC
463
Fig. 1 Cellulase activity of Different Bacterial isolates
3.2 Optimization of Cellulase Enzyme from SCB9 Strain
3.2.1 Optimization of Physical Factors by Response Surface
Methodology
From the RSM study, a highest cellulase activity for the cellulolytic bacterial strain
SCB9 in an optimized condition when the independent variables were maintained at
incubation time 42 h, pH 9, substrate concentration 15 gm/L and temperature 37.5 °C
(Fig. 2).
3.2.2 Regression Analysis
Regression analysis was carried out to fit the mathematical model to the experimental data in order to determine the optimum conditions that result in the maximum
enzyme activity. By applying multiple regression analyses, on the experimental
data, a second-order polynomial equation was found to represent the relationship
between enzyme activity, incubation time, pH, substrate concentration, and temperature adequately. This second-order polynomial equation obtained from multiple
regression analysis is shown to explain cellulase activity of the cellulolytic bacterial
strain SCB9 regardless of the significance of the coefficients. If Y is the response
value of cellulase activity (Fig. 2), then the fitted response surface model is:
Cellulase activity(Y ) = +133.02 + 33.09 ∗ A + 57.46 ∗ B
+ 125.66 ∗ C − 51.68 ∗ D + 13.50 ∗ AB
+ 116.91 ∗ AC − 22.22 ∗ AD + 184.23 ∗ BC